|
|
| Aircraft Commander | Chris Kerns |
| Co-pilot | Cathy Martin |
| Co-pilot | Nate Kahn |
| Navigator | Pete Freeman |
| Navigator | Tim Gallagher |
| Flight Engineer | Brigham |
| Flight Engineer | Chris LaLonde |
| Flight Director | Jess Williams |
| Flight Director | Jack Parrish |
| Data Technician | Bobby Peek |
| Radio | Damon San Souci |
| Dropsonde Operator | Dana Naeher |
| Dropsonde Operator | Steve Paul |
| Lead Project Scientsit | Robert Rogers | HRD |
| Lead Project Scientsit | Paul Chang | NESDIS |
| Radar Scientist | Evan Kalina | HRD |
| Dropsonde Scientist | Kelly Ryan | HRD |
| Observer | David Hall | OMAO |
| Guest | David Jolly | Congress |
| Guest | Preston Rudel | unk |
| Radar Scientist | Paul Reasor | HRD |
Mission Plan :
|
|
|
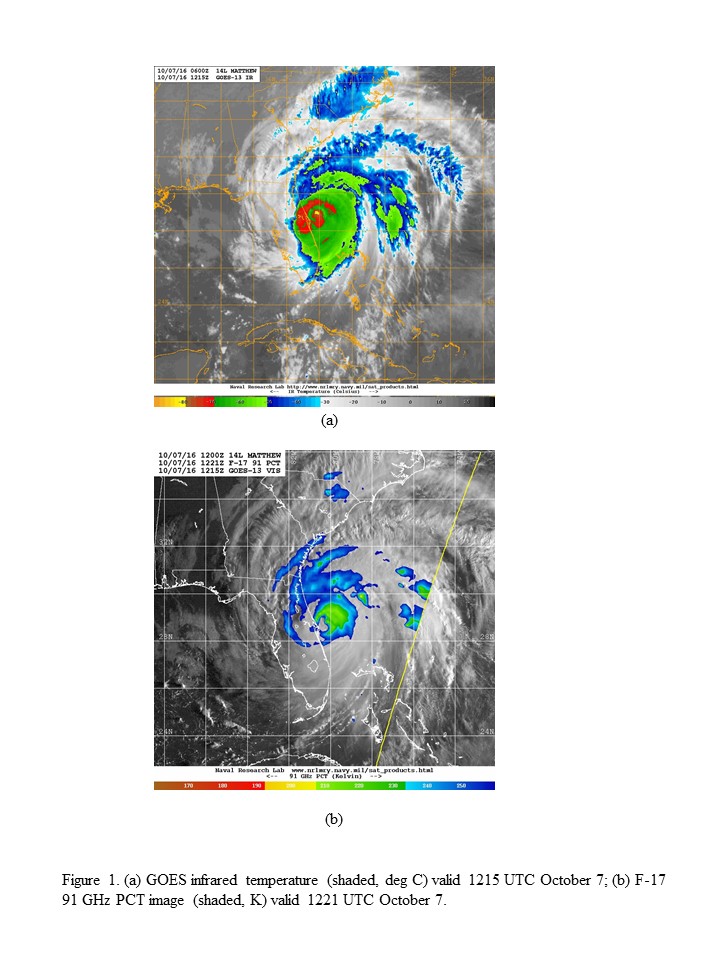
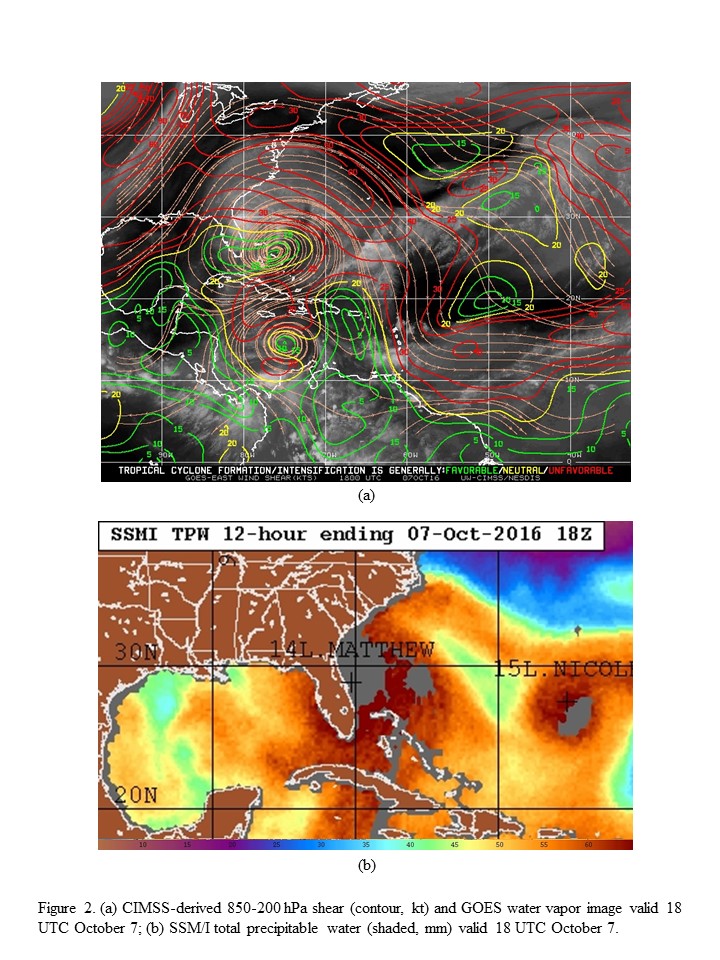
NOAA 43 will fly a TDR pattern into Hurricane Matthew, a category 3 hurricane just off the coast of Florida near Daytona Beach. Matthew was analyzed as a 105-kt hurricane at the NHC 11AM advisory, 3 h before planned takeoff. The storm had been paralleling the Florida coast for the past 24-36 hours. In the hours leading up to the start of the mission the storm began to show the impacts of interacting with the Florida peninsula, as well as the increasing westerly shear to its north. Some localized areas of cold cloud tops were near the storm center (Fig. 1a), but there was an erosion of cold tops on the northwest side of the storm, and some elongation toward the northeast of the high-level clouds on the north side. Microwave 91 GHz imagery (Fig. 1b) showed that the primary area of ice scattering, indicative of deep convection, was located on the east and northeast sides of the storm, off the coast of Florida. Matthew was entering an area of significantly higher southwesterly shear of 20-30 kt (Fig. 2a). The low-level humidity environment (Fig. 2b) continued to show a region of high total precipitable water (TPW) and a moist environment east and south of the storm. While not apparent in the TPW plot, the proximity to land likely led to some drier air intruding into the system from the west.
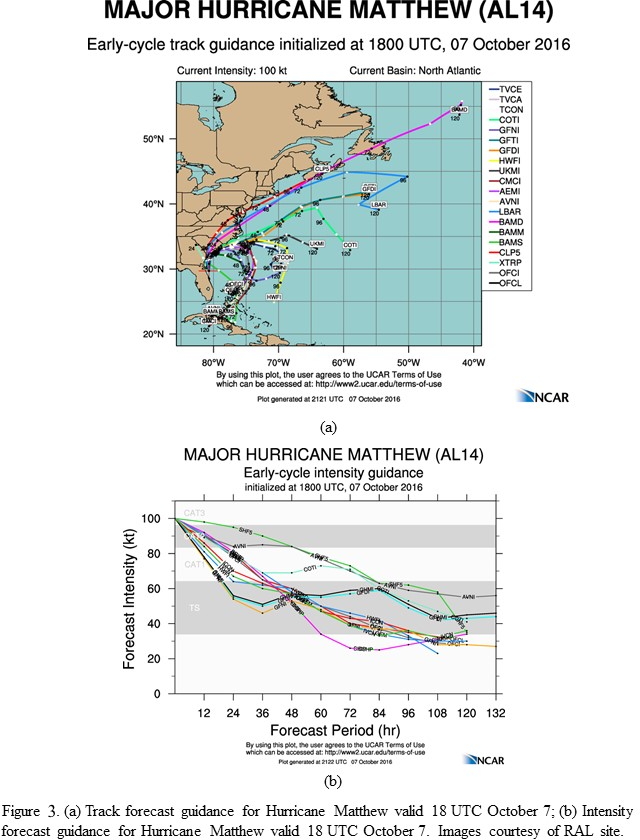
Numerical model guidance (Fig. 3a) showed that Matthew was expected to continue tracking along the southeast coast of the U.S., before pulling away from the coast in 24-48 h and potentially looping back toward the south and southwest. The intensity guidance showed an expected steady decrease in intensity, likely due to the proximity to land and interaction with high vertical wind shear.
|
|
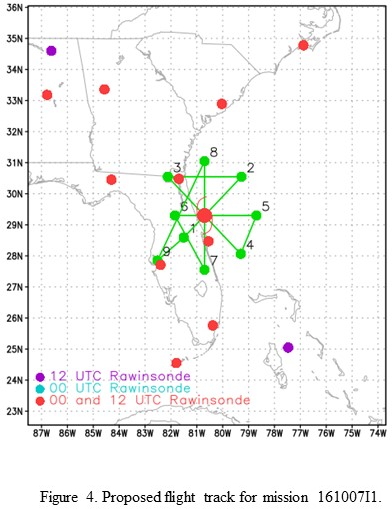
The mission plan called for a rotated figure-4, with an IP on the SW side and final point on the N side (Fig. 4). Altitude is 10,000 ft pressure on the first pass, then descend to 7000 ft. radar altitude for the IWRAP. After either one or both figure-4's are done, do some Ocean Winds work (repeated radials). After the lass pass, fly a north-south leg along and just offshore of the coasat, releasing dropsondes near ground-based observing platforms. Otherwise release sondes at all turn points over water, and anywhere requested by NHC. No AXBT's will be dropped.
|
Prepared by Hurricane Research Division Prepared by the Hurricane Research Division File: current1.ftk October 07, 2016 10:00:00 AM Aircraft: N43RF Proposed takeoff: 7/1800Z | |||||||
| DROP LOCATION TABLE | |||||||
| # | LAT | LON | RAD/AZM | Time | |||
| deg min | deg min | n mi/deg | hr:min | ||||
| 1S | 28 35 | 81 30 | 60/225 | 1:05 | |||
| 2S | 30 33 | 79 17 | 105/045 | 1:49 | |||
| 3S | 30 33 | 82 07 | 105/315 | 2:29 | |||
| 4S | 28 04 | 79 18 | 105/135 | 3:26 | |||
| 5S | 29 18 | 78 42 | 105/090 | 3:48 | |||
| 6S | 29 18 | 81 51 | 60/270 | 4:32 | |||
| 7S | 27 33 | 80 42 | 105/180 | 5:05 | |||
| 8S | 31 03 | 80 42 | 105/000 | 6:02 | |||
Mission Summary :
| Take off | Landing
| MacDill AFB, FL
| 17:56 UTC
| MacDill AFB, FL
| 00:15 UTC
| Penetrations
| 5
| | ||||
|
|
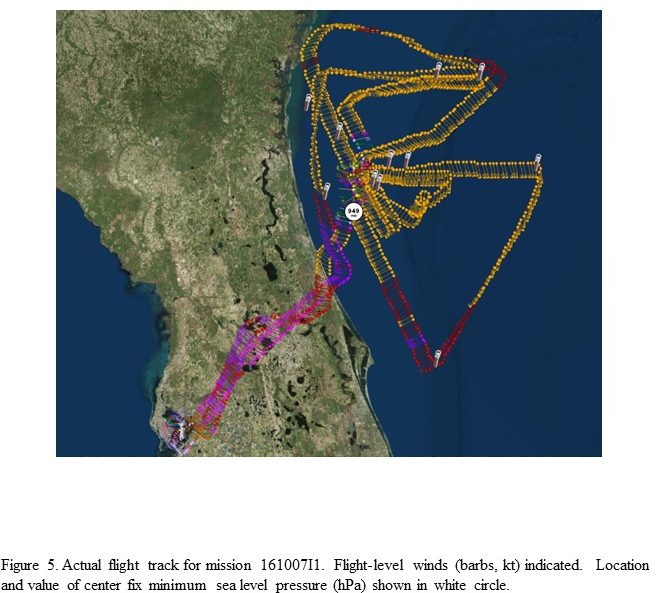
The actual flight track in shown in Fig. 5. Takeoff was at 1756 UTC from Tampa. The pattern was flown generally as planned through the first figure-4. However, during the second inbound leg from the NW the motor on the tail Doppler radar (TDR) failed, resulting in a failure in that system. We finished the figure-4 and then flew downwind to a point east of the center, where we did some repeated radials and wedge patterns for Ocean Winds. At 2247 UTC there was a satellite overpass that NESDIS (Paul Chang) wanted to fly coordinated with the P-3 on the NE side of the storm. From there, we flew downwind to a point ~10 nm north of the sticknet along the coastline. We flew a line toward the south, ~12 nm off the coastline, and dropped sondes at the latitude of the sticknet, the latitude of the radius of maximum winds for the onshore flow, and the mirror south of the center for the offshore flow. From there the aircraft returned to MacDill.
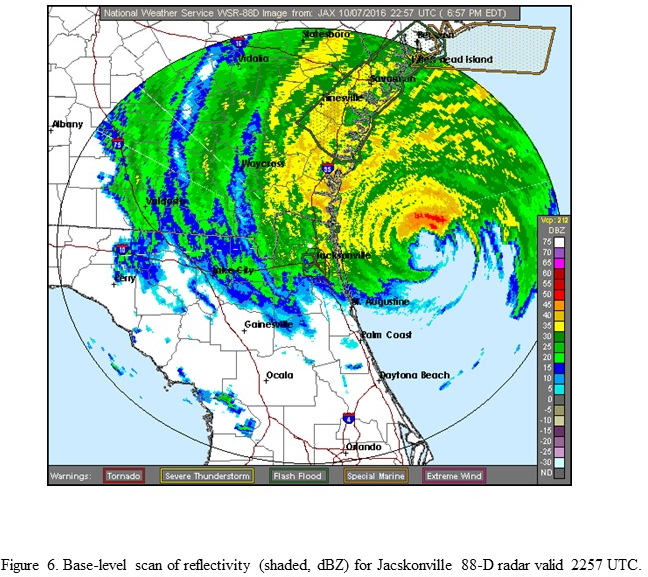
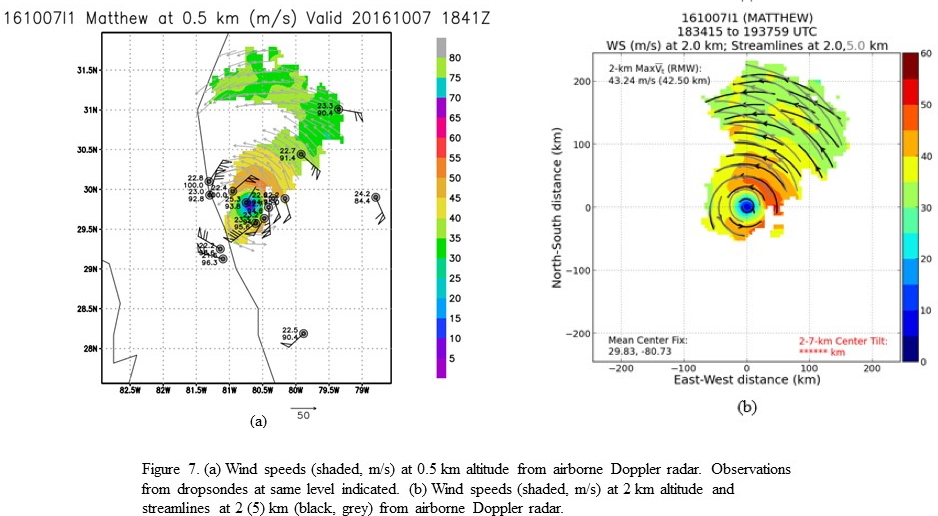
The storm showed a pronounced asymmetry in the precipitation field, with virtually all of the rainfall on the north side of the storm (Fig. 6). The winds at 0.5 km altitude were strongest on the east side of the storm, with values > 50 m s-1 (Fig. 7a). Despite this asymmetry, the storm remained essentially vertically aligned (Fig. 7b).
The aircraft landed at 0015 UTC.
|
Mission Evaluation :
One radar analysis was created and transmitted in real time, and 15 dropsondes plus 3 mini dropsondes were released. With the failure of the TDR less than halfway into the pattern, the mission did not meet its primary objective. However, the mission did accomplish some scientific objectives, including the coastal N-S run, the Ocean Winds wedges, and the coordination with the satellite overpass.
Problems :
The primary problem with this flight was the failure of the TDR motor.
Rob Rogers
Oct. 14, 2016
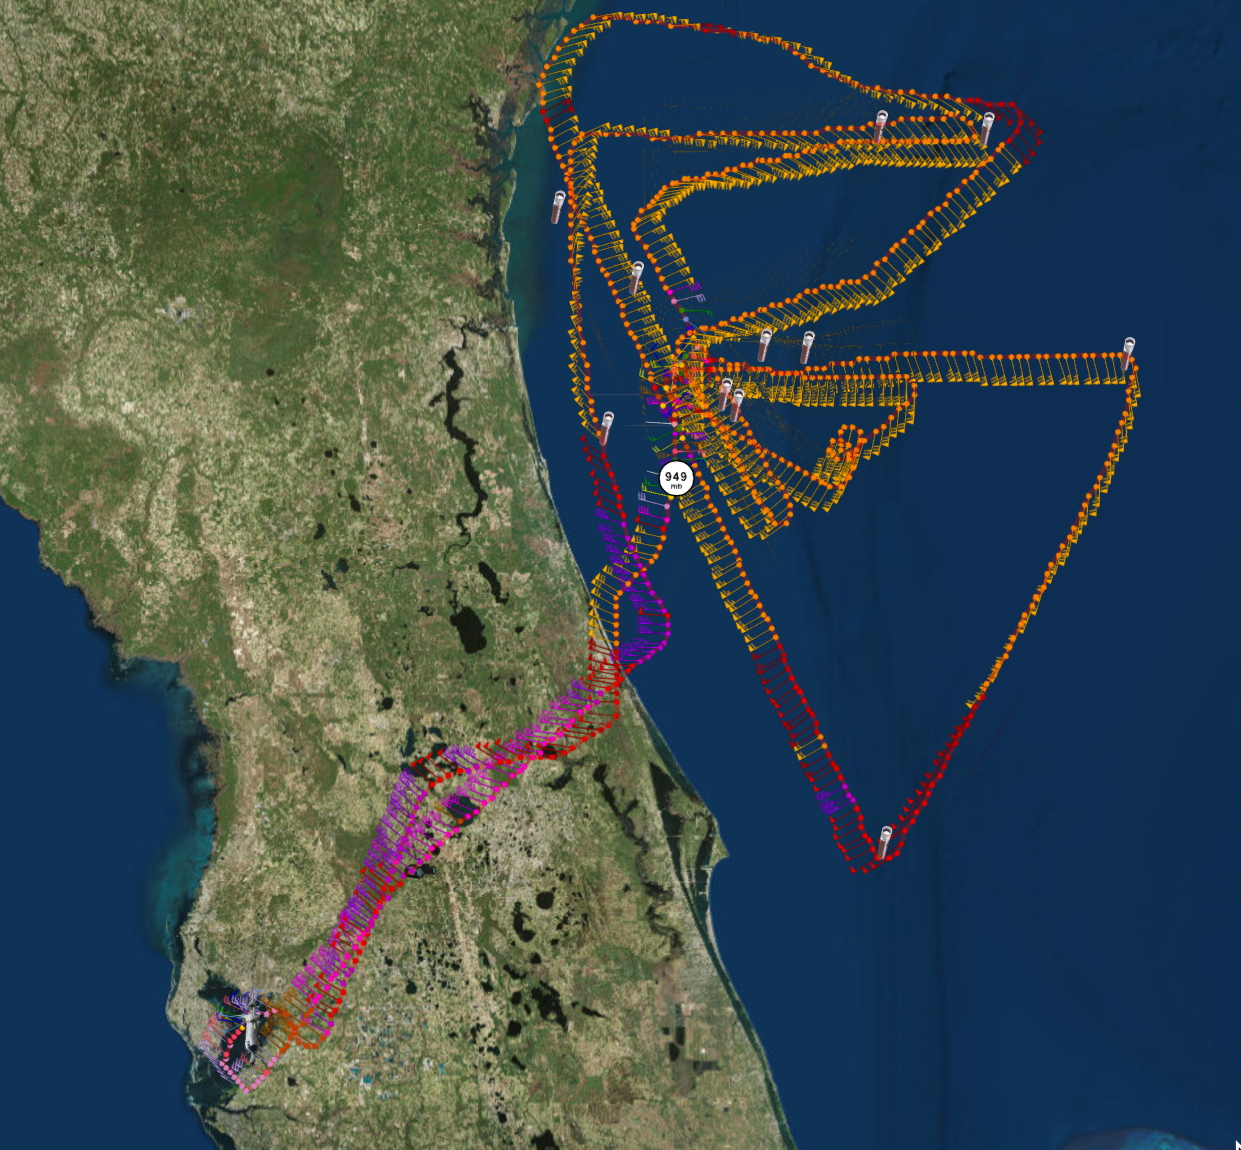
Final flight track |
||

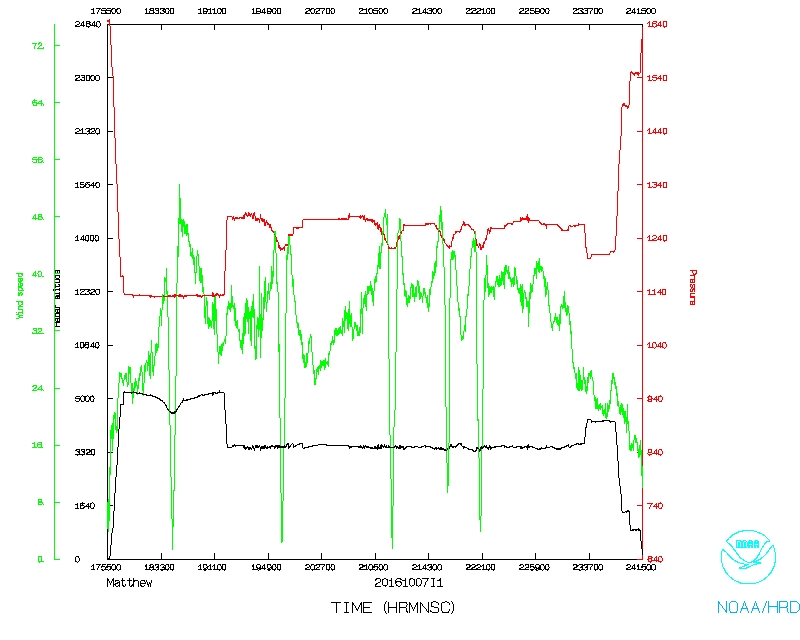
Plot of raw High Density Obs |
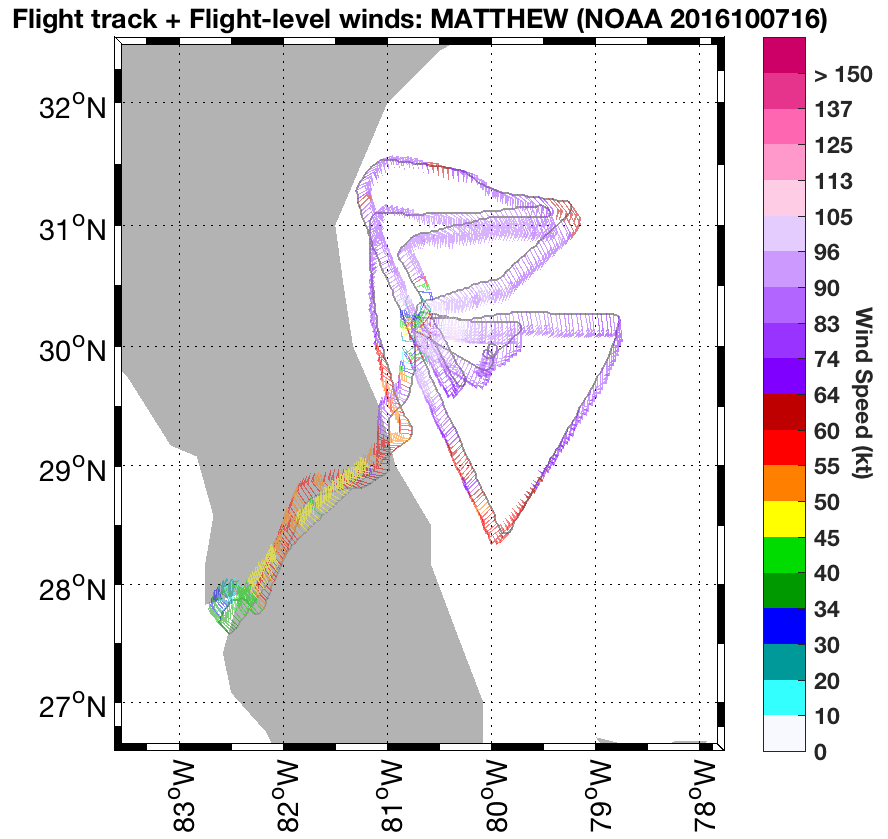
Plot of raw Flight Level winds |
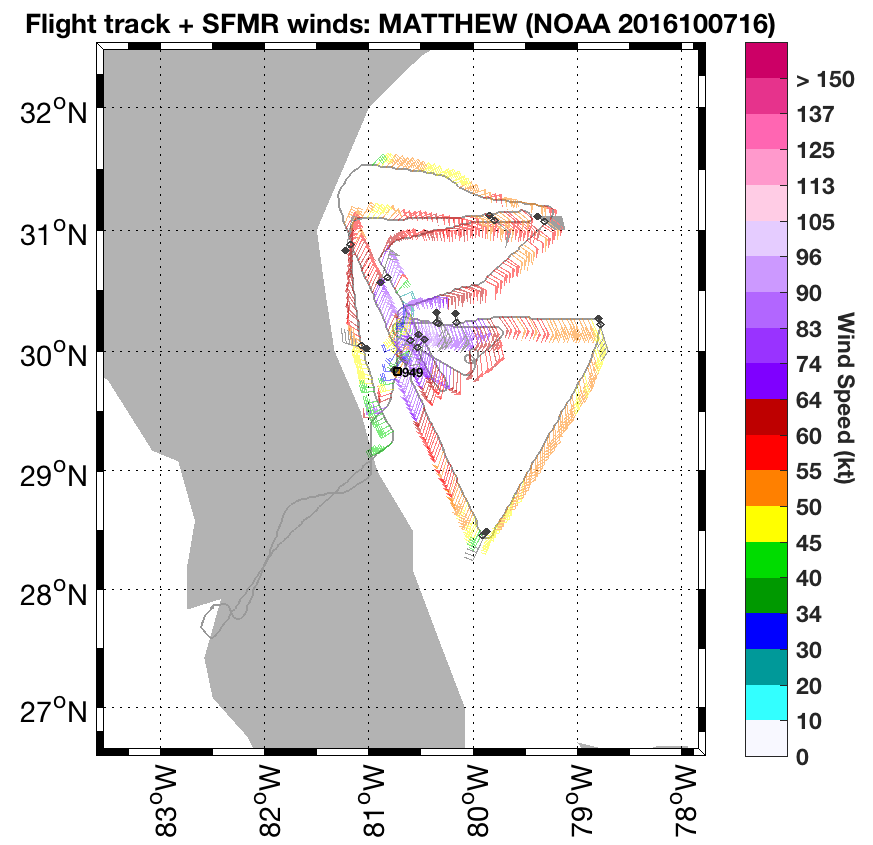
Plot of raw SFMR winds |
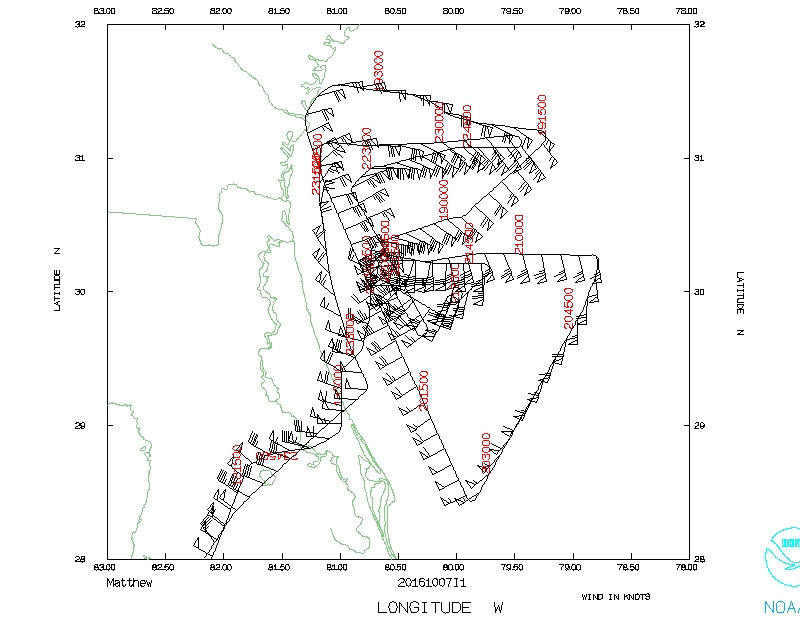 Flight track |
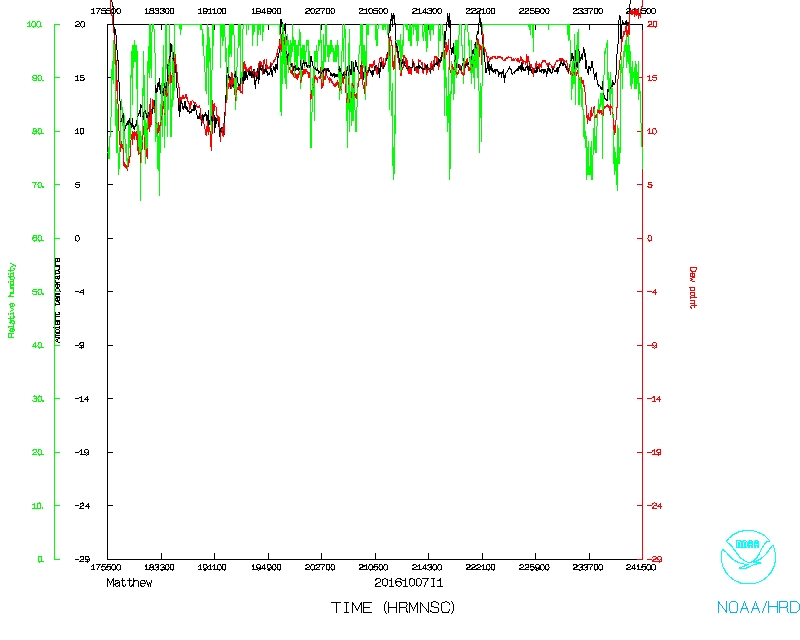 Temperature and Moisture |
 Wind and Atlitude |
LPS's log | Radar Scientist's log | Ground Radar Scientist's log | Dropsonde Scientist's log
Flight Director's manifest |
Flight Director's log |
SFMR data |
NetCDF data
serial data
1 second data |