|
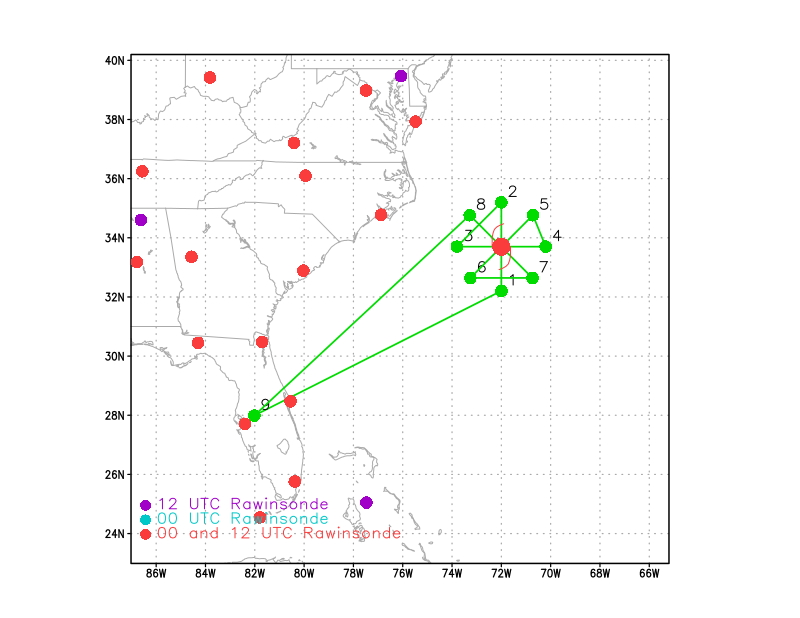
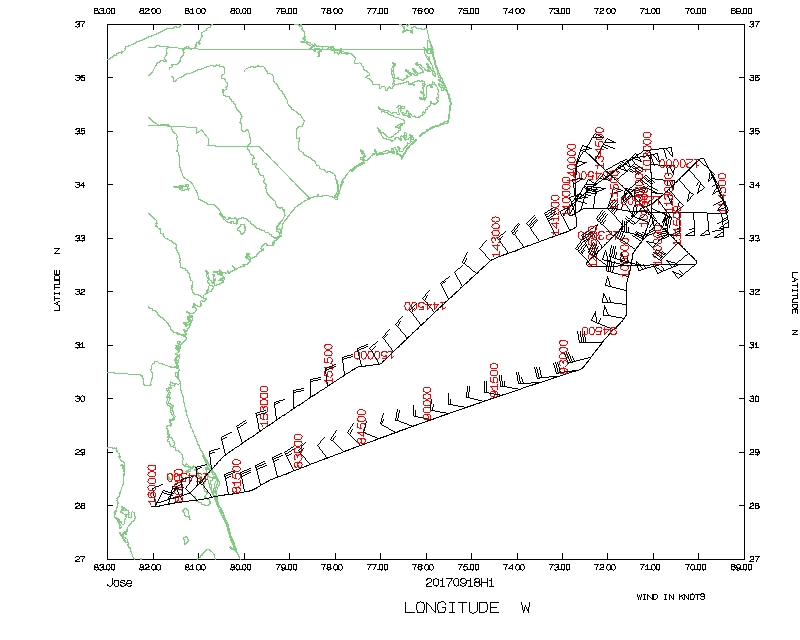
| Figure 1. Proposed flight track for 20170918H1 |
| Aircraft Commander | Justin Kibbey |
| Co-pilot | Pat Didier |
| Co-pilot | Mitchell |
| Flight Engineer | Paul Darby |
| Flight Engineer | Tuffnell |
| Navigator | Sam Urato |
| Navigator | Sloan |
| Flight Director | Jess Williams |
| Flight Director | Ian Sears |
| System Engineer | Akshar Patel |
| Data Technician | Terry Lynch |
| Dropsonde Operator | Todd Richards |
| Lead Project/Radar Scientist | Jon Zawislak | HRD |
| Dropsonde/DWL Scientist | Kelly Ryan | HRD |
| Radar Scientist | John Gamache | HRD |
Mission Plan :
|
|
| Figure 1. Proposed flight track for 20170918H1 |
NOAA 42 will conduct a rotated Figure-4 at 10k ft pressure altitude (altitude may vary due to de-confliction with Teal) with 90 nm radial legs (Figure 1). Dropsondes (potentially up to 9 total for entire pattern) will be launched at each turn point in the first Figure-4 pattern (4 total), as well as on each center pass, if requested by NHC (potentially up to 4). We'll also drop a sonde at ferry altitude halfway to the IP, per EMC request. SHIPS shear as of 0000 UTC analysis is 231°/37 kt. The NHC advisory at 2 am EDT / 0600 UTC: Motion, 360°/8 kt; Intensity, 80 kt, 972 mb; Position, 32.6°N / 71.6°W. The NHC forecast position at 1200 UTC is 33.4°N / 71.6°W.
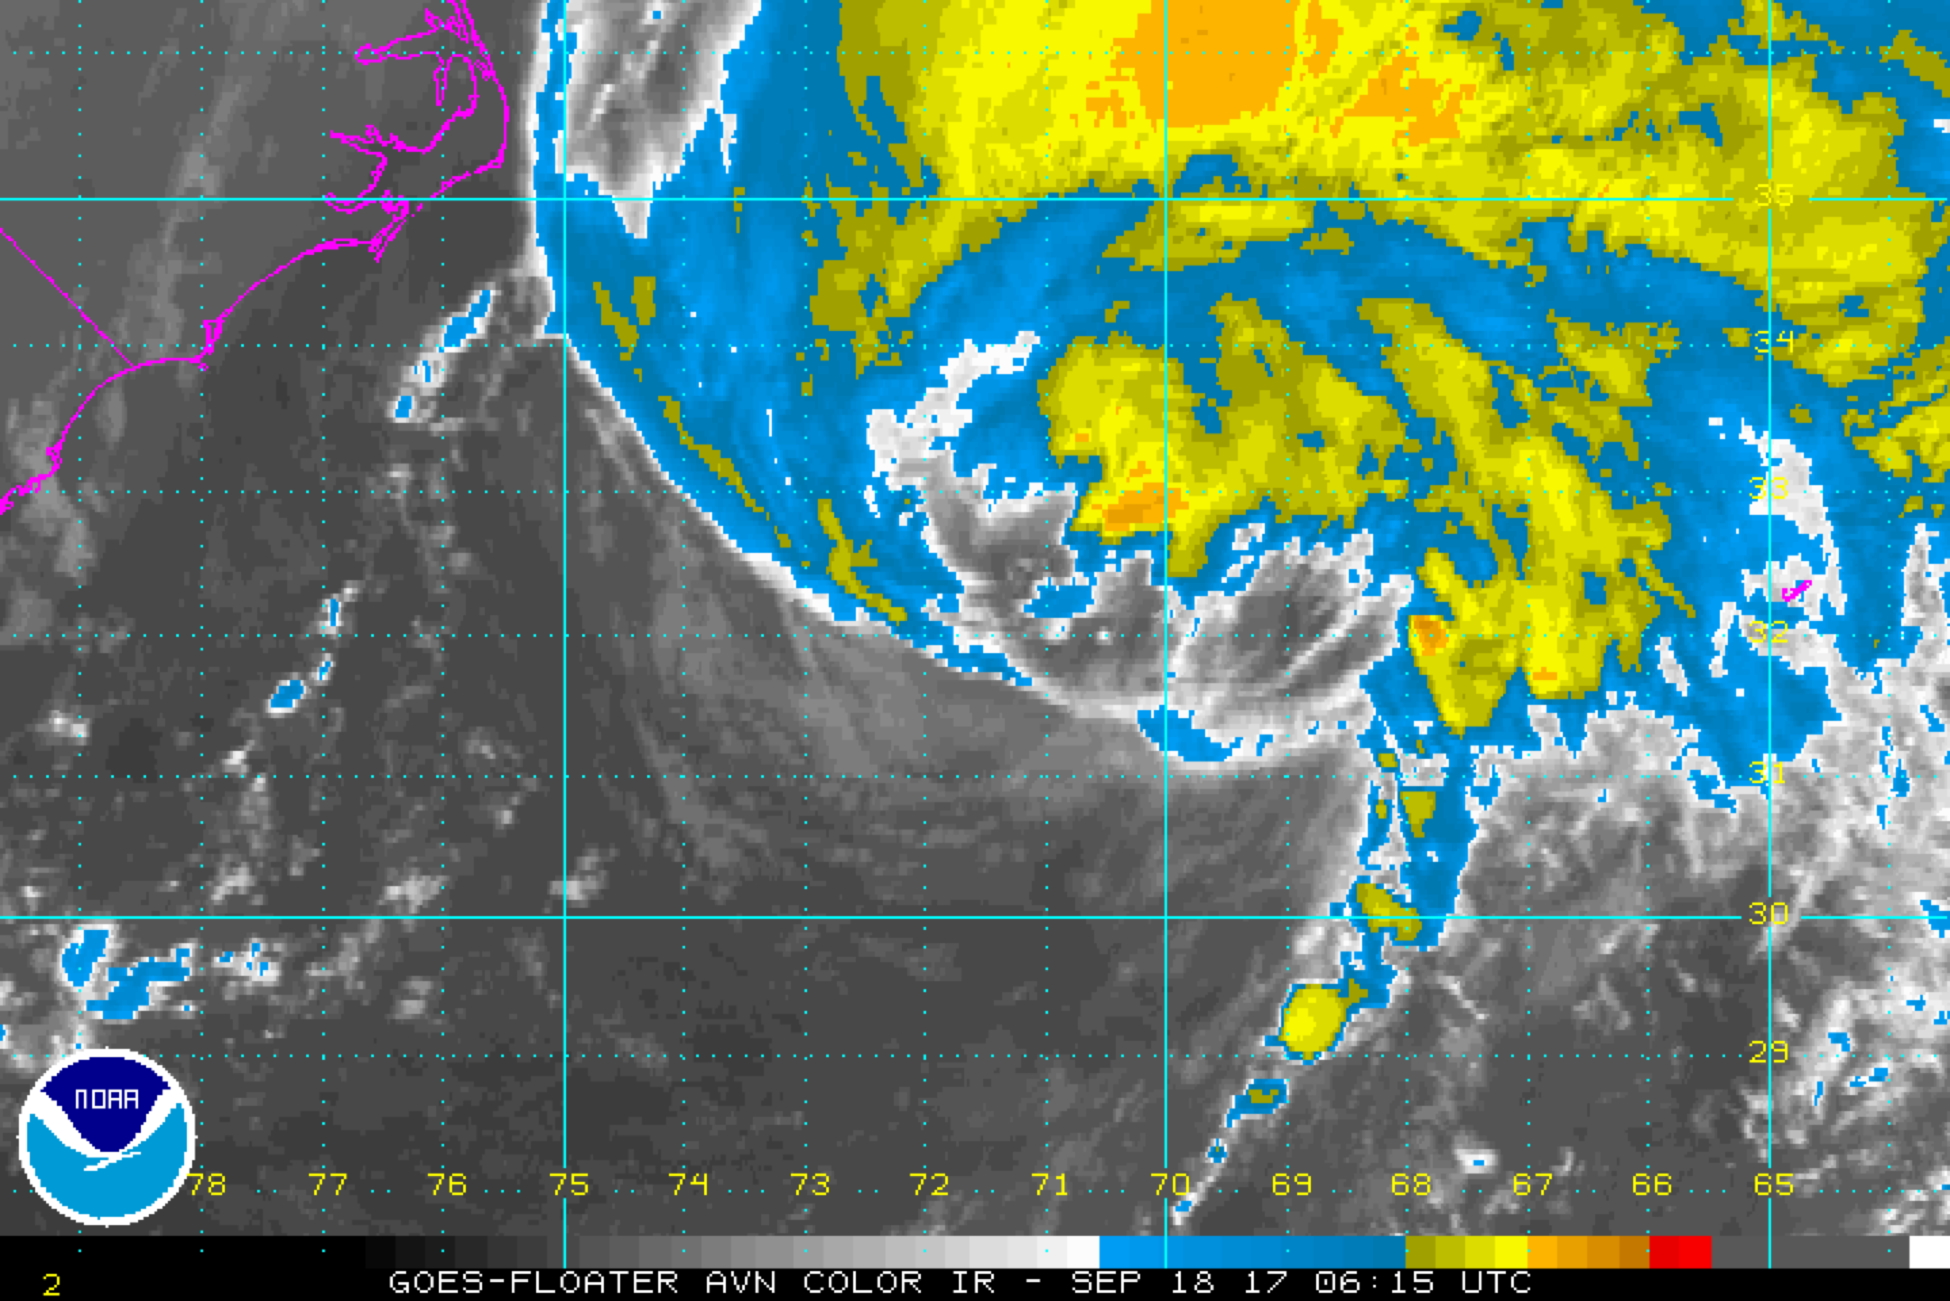
Figure 2. GOES-13 IR imagery of Jose from 0615 UTC 18 September |
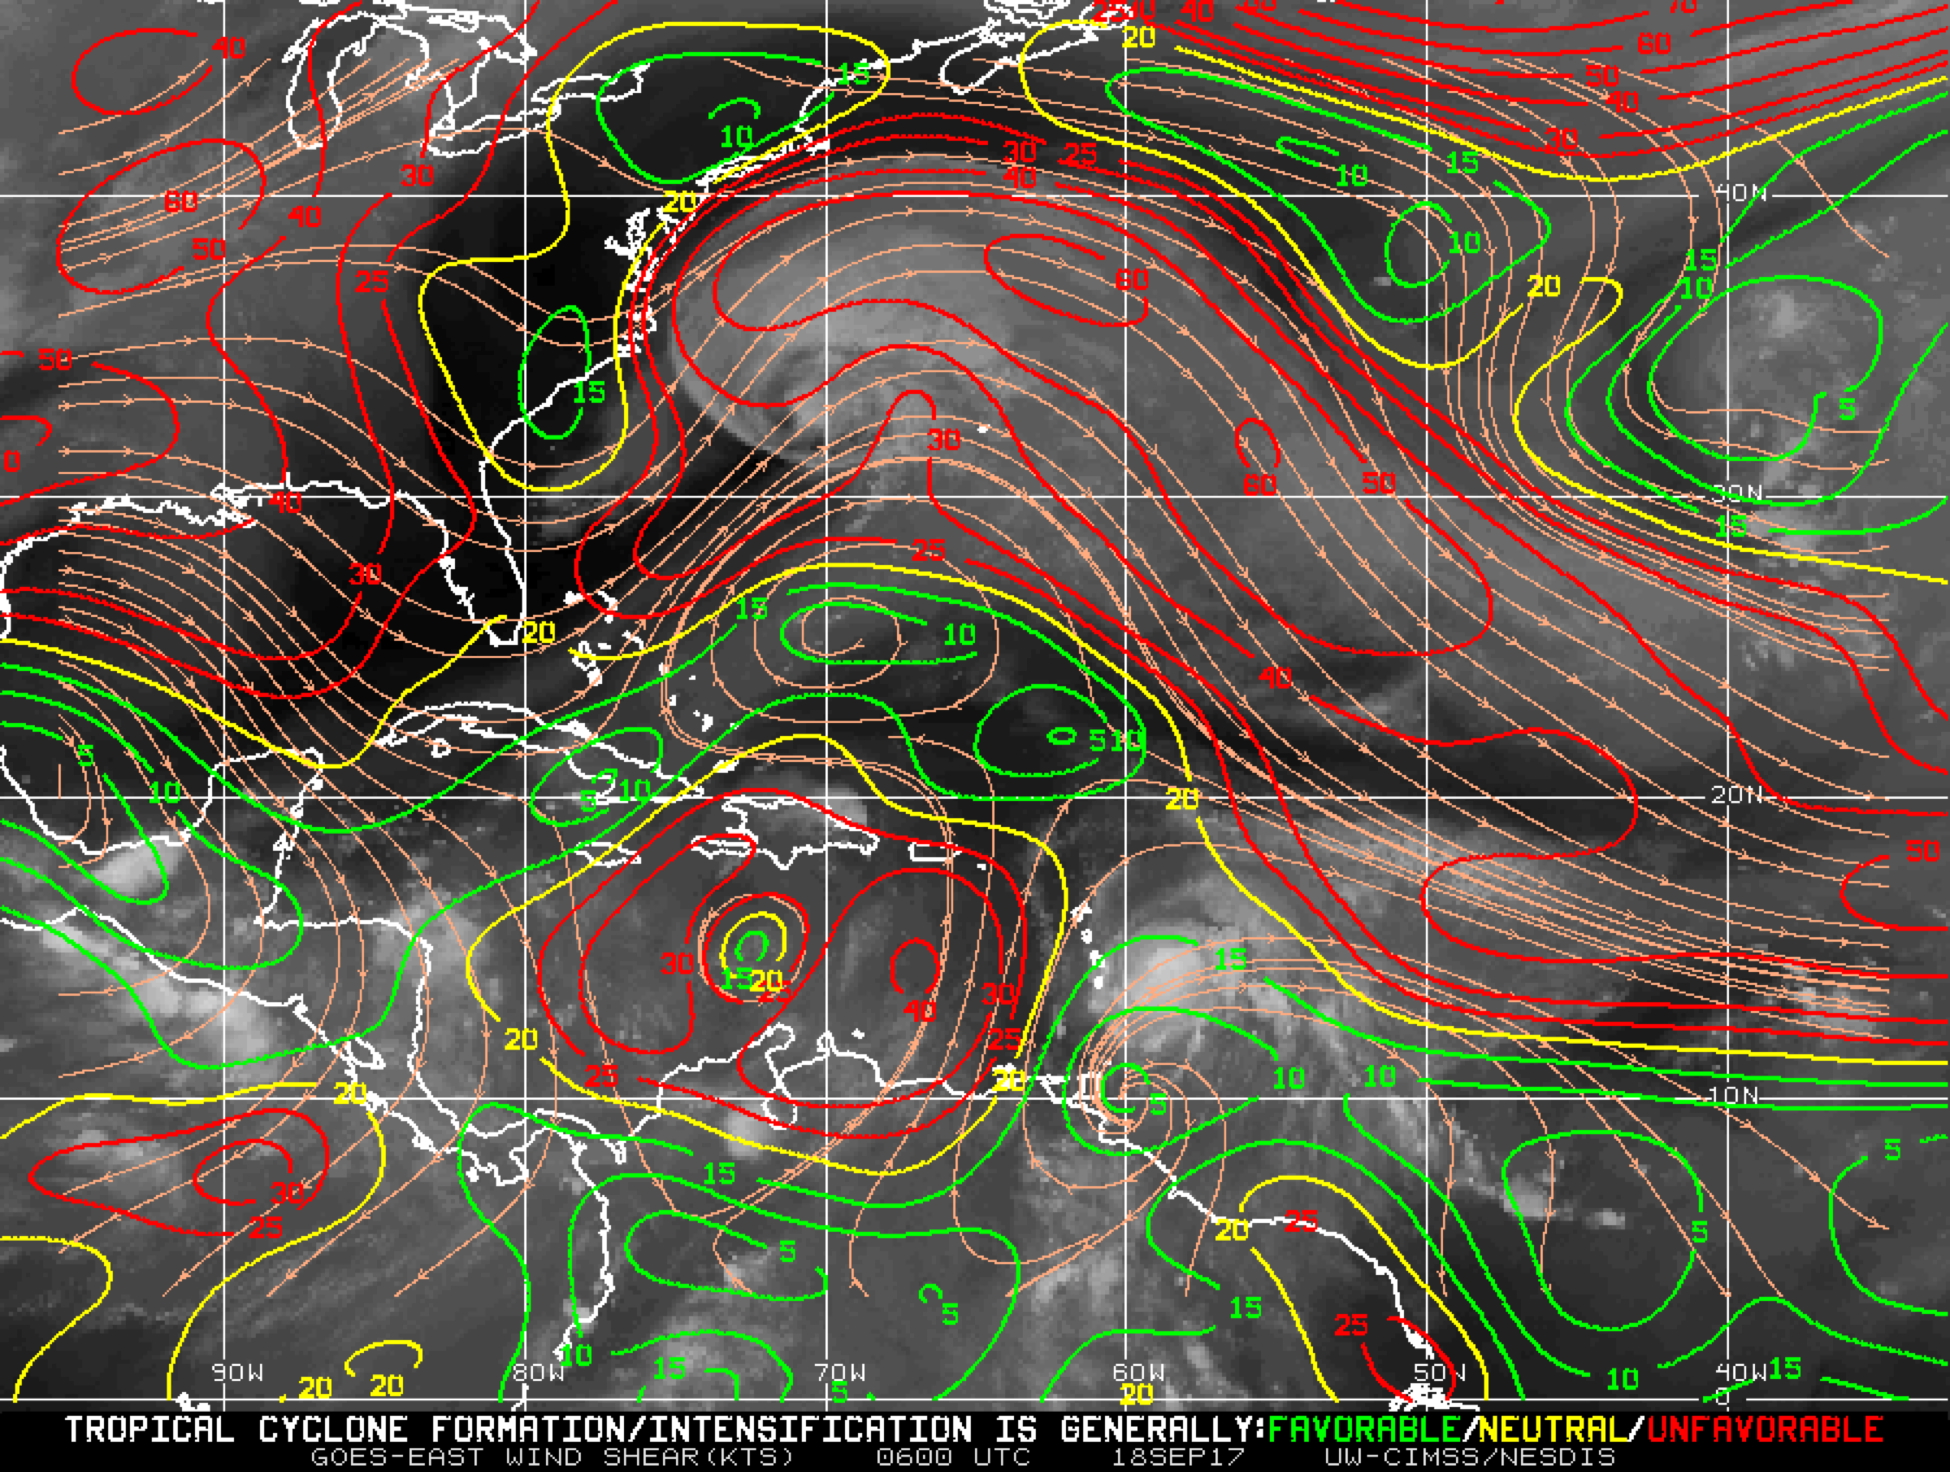
Figure 3. IR imagery and CIMSS-derived deep-layer (850-200 hPa) vertical wind shear (contoured; contours colored by favorability for intensification, with green being "favorable', yellow being "neutral', and red being "unfavorable'), valid at 0600 UTC 18 September (images courtesy CIMSS, tropic.ssec.wisc.edu) |
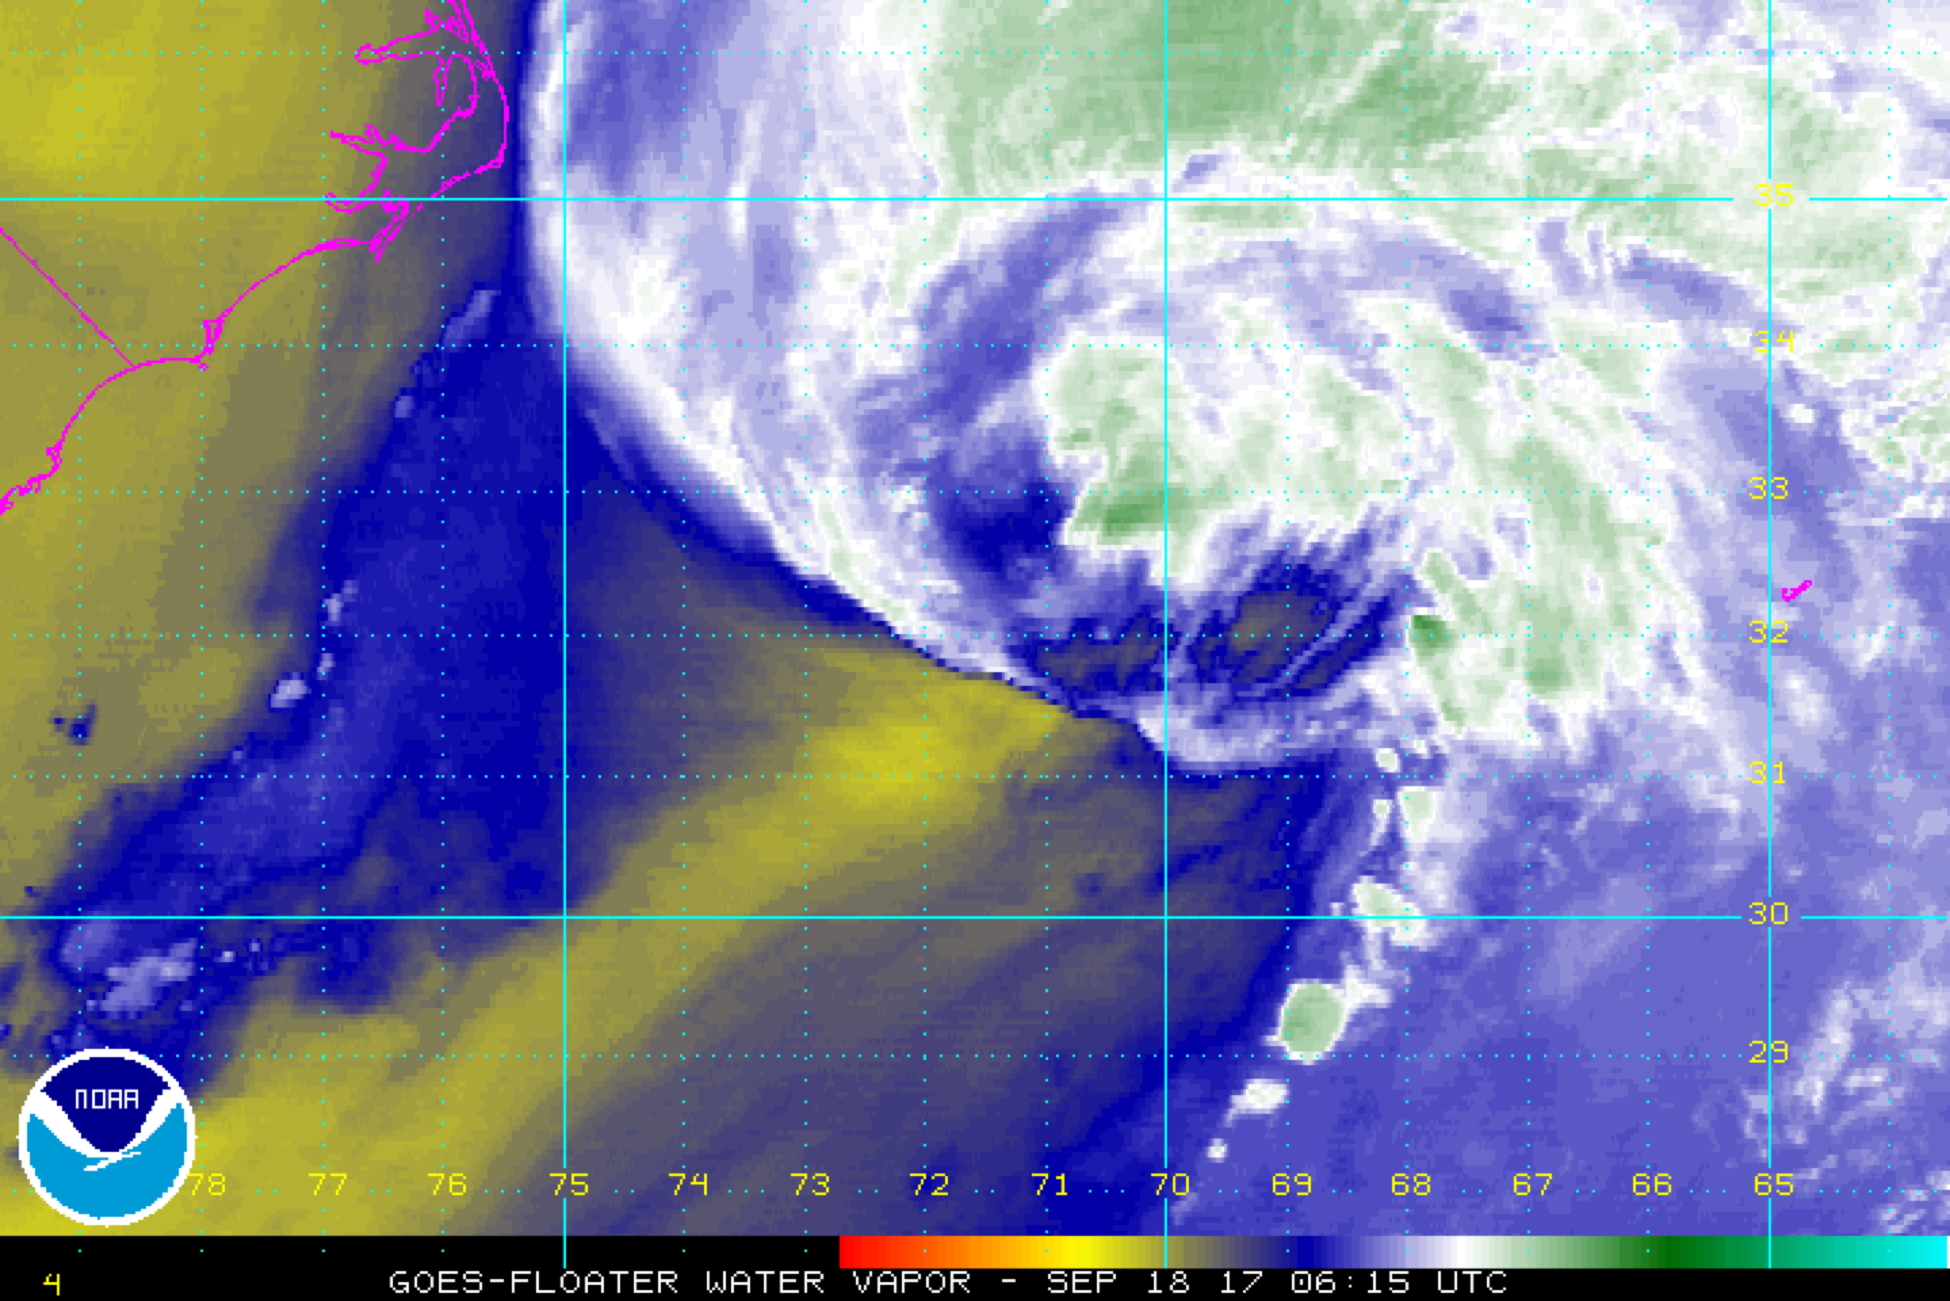
Figure 4. GOES-13 WV imagery of Jose from 0615 UTC 18 September |
The satellite presentation of Irma over the past few hours has degraded. The colder cloud tops and deep convection seen during the previous mission (20170917H1) around the center have disappeared (Fig. 2). This is obviously a consequence of the strong southwesterly shear (Fig. 3) influencing Jose, as well as the dry air that appears to be entraining into the inner core (Fig. 4). Jose is expected to continue to experience these conditions, which will likely result in slow weakening (Fig. 5) as it moves to the north (Fig. 6).
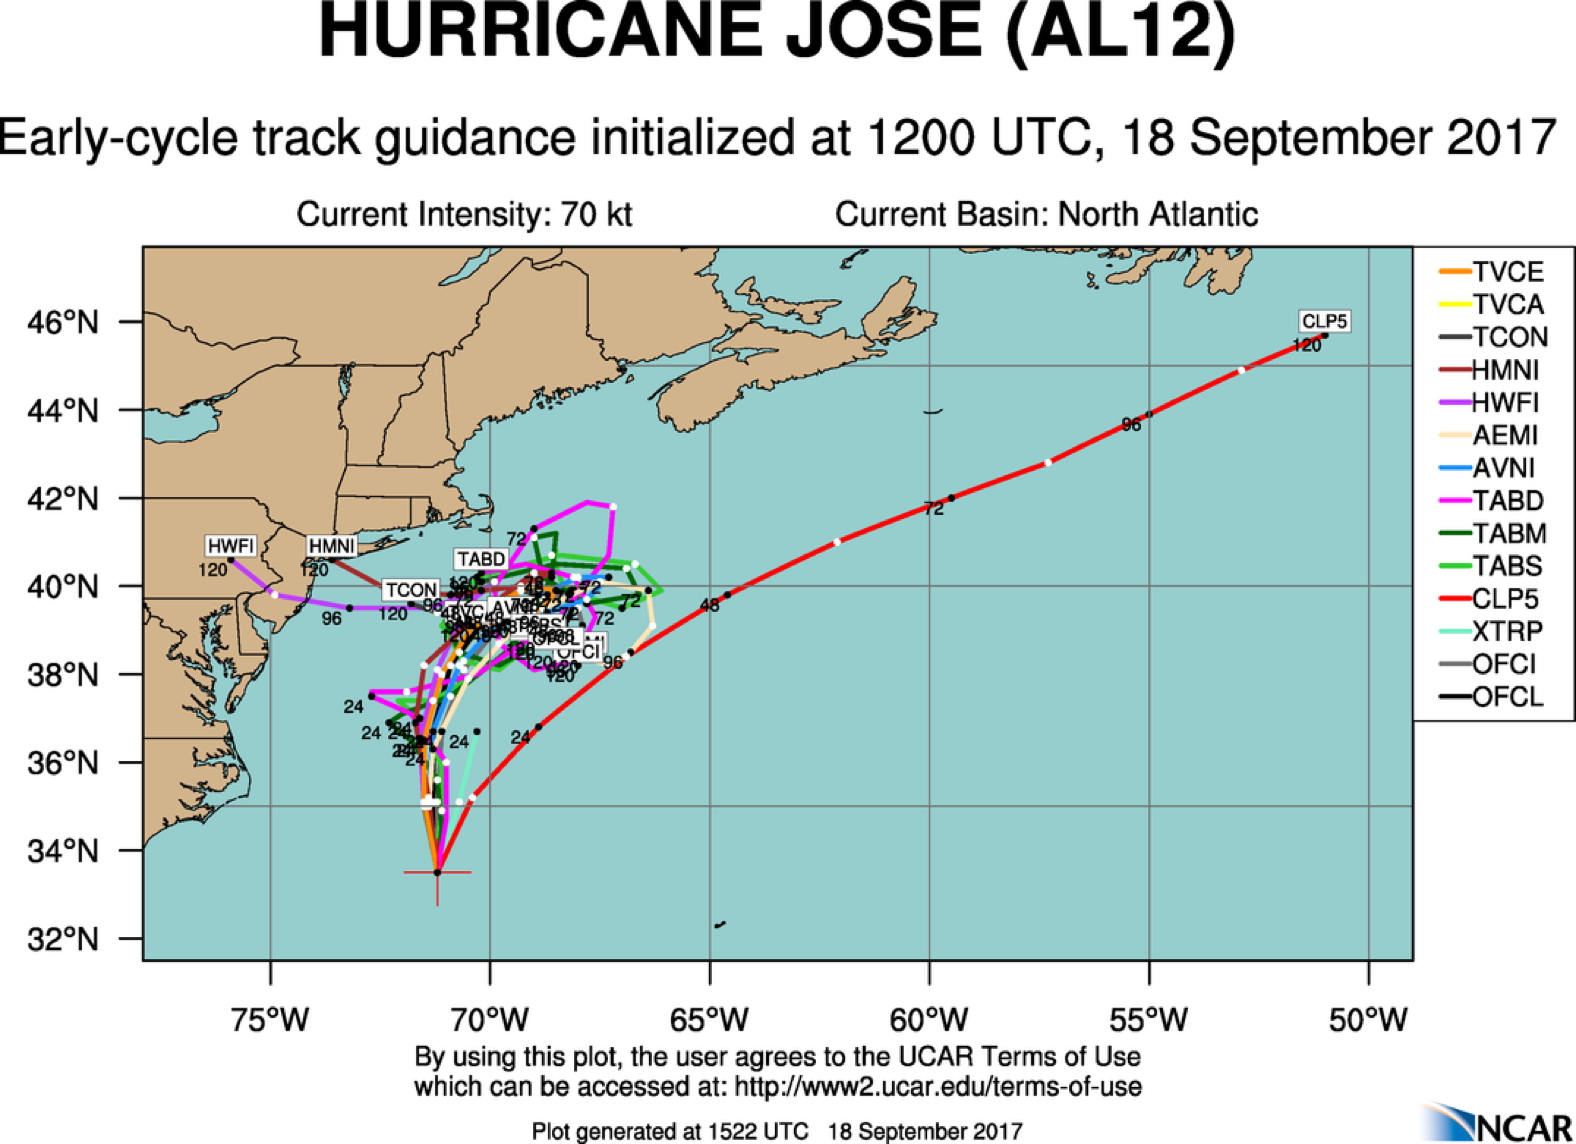
Figure 5. Track forecast guidance for Jose valid 1200 UTC 18 September (image courtesy http://www.ral.ucar.edu/guidance/realtime/current/) |
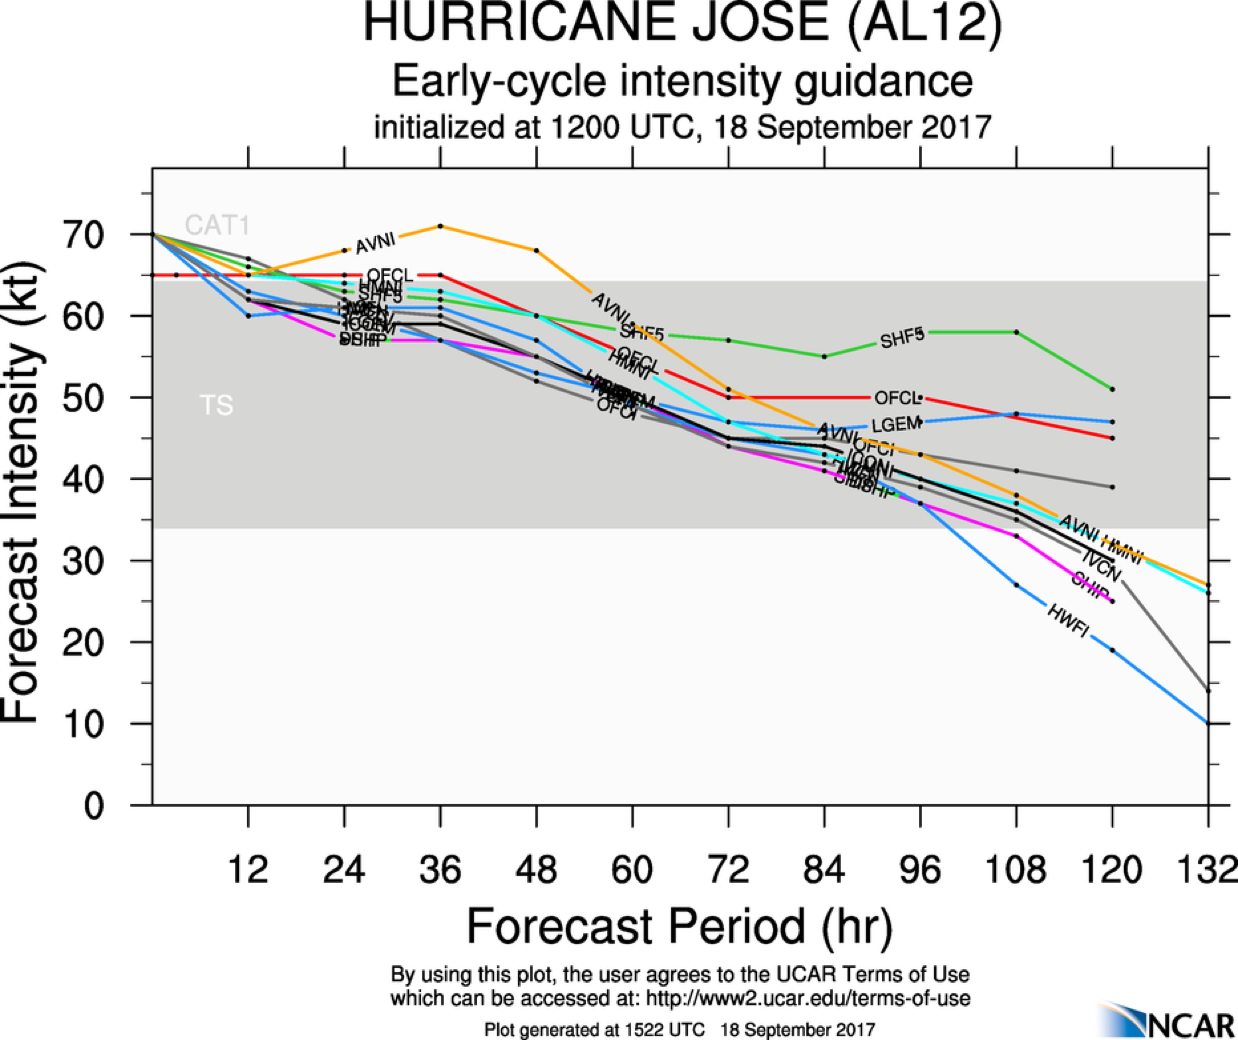
Figure 6. Intensity forecast guidance for Jose valid 1200 UTC 18 September (image courtesy http://www.ral.ucar.edu/guidance/realtime/current/) |
|
Prepared by the Hurricane Research Division August 07, 2017 Aircraft: N42RF Proposed takeoff: 18/0800Z
DROP LOCATION TABLE
| #
| LAT
| LON
| RAD/AZM
| Time
|
| deg min
| deg min
| n mi/deg
| hr:min
| 1S | 32 12 | 72 00 | 90/180 | 1:47
| 2S | 35 12 | 72 00 | 90/000 | 2:33
| 3S | 33 42 | 73 48 | 90/270 | 3:05
| 4S | 33 42 | 70 12 | 90/090 | 3:51
| 5S | 34 46 | 70 43 | 90/045 | 4:09
| 6S | 32 39 | 73 15 | 90/225 | 4:55
| 7S | 32 39 | 70 45 | 90/135 | 5:27
| 8S | 34 46 | 73 17 | 90/315 | 6:13
| | ||||||||||||||
Mission Summary :
| Take off | Landing
| Linder-Lakeland, FL
| 07:50 UTC
| Linder-Lakeland, FL
| 16:02 UTC
| Expendables
| 6 Dropsonde (5 HFIP, 1 NHC)
| | ||||
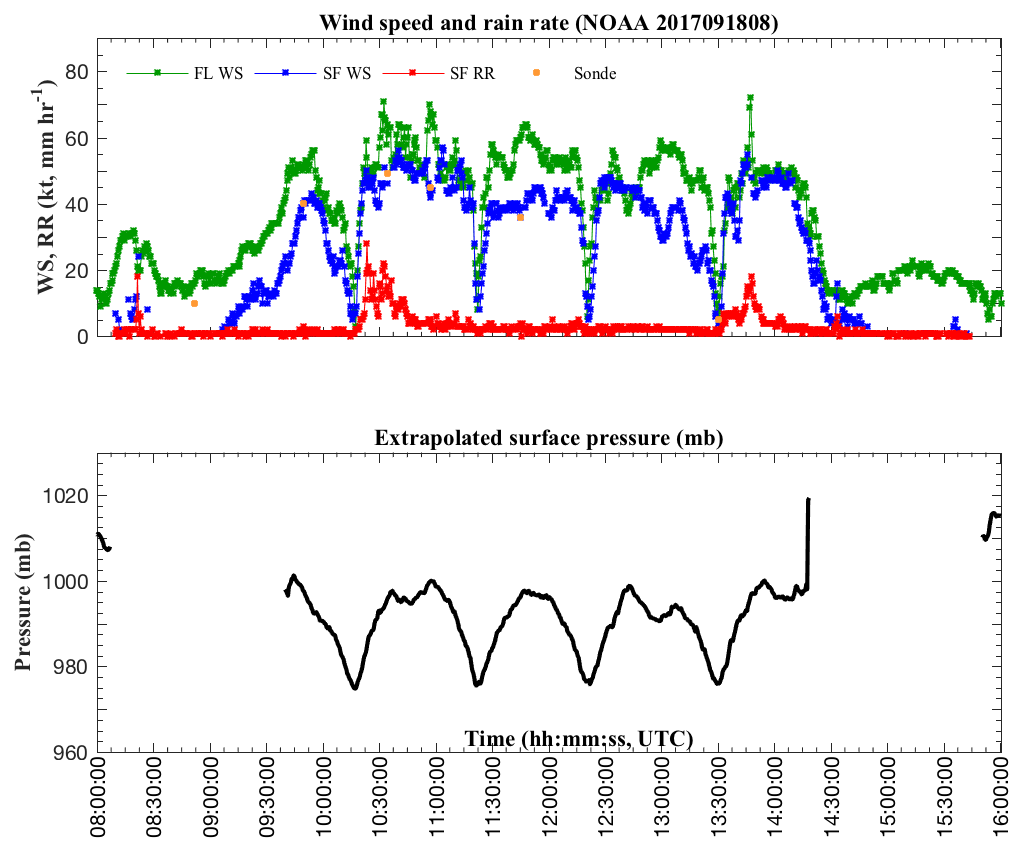
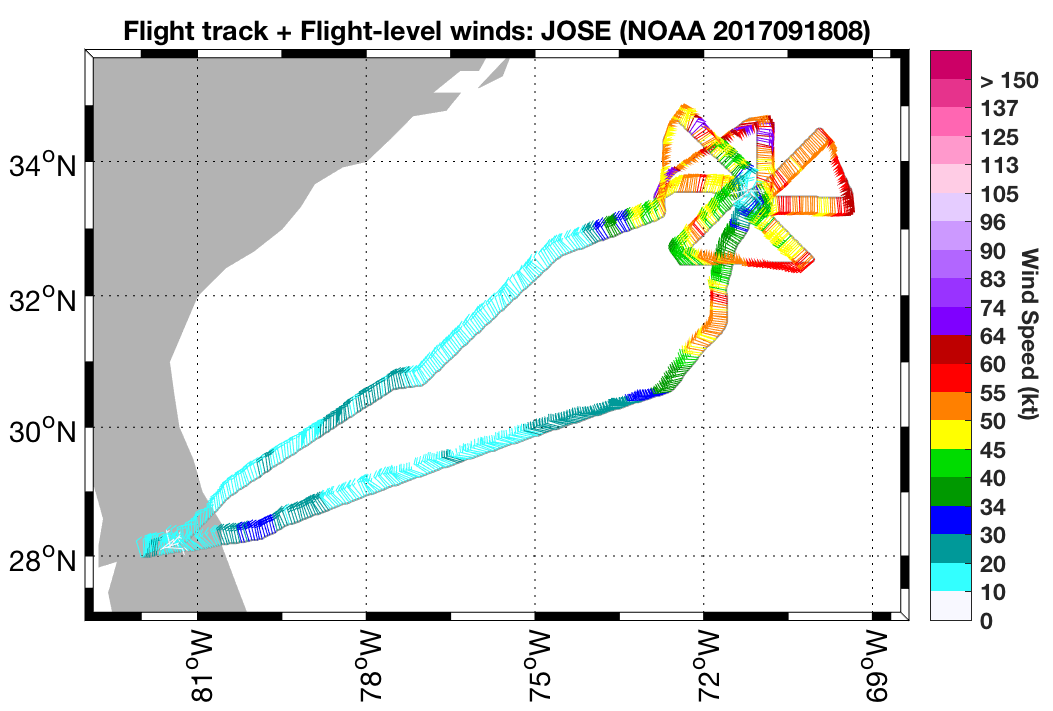
The actual flight track from this mission is shown in Fig. 8, while the time series of flight-level (FL) wind speed, SFMR surface wind and rain rate, and extrapolated surface pressure are shown in Fig. 9. Enroute to the IP, we dropped a sonde approximately halfway on the transit (Sonde #1) at 0852 UTC, near 29°23'N / 76°35'W at an altitude of approximately 21 kft. While in transit the satellite presentation did not improve as precipitation (and a noticeable lack of deep convection) remained to the north and west of the center, with predominantly clear (no rain) conditions in all other quadrants, including over the center of Jose. We descended to our pattern altitude of 8 kft pressure, arrived at the IP at 0950 UTC near 33°19'N / 71°3'W, dropped a sonde (Sonde #2) and proceeded inbound along 180°. Conditions were clear at flight altitude and above, with only shallow cloud at FL and below. Some semblance of a center appeared in the lower fuselage (LF) imagery, indicated by curvature in the precipitation within the NW quadrant (Fig. 9; IR imagery in Fig. 10). We fixed the center at 1017 UTC near 33°23'N / 71° 3'W and proceeded outbound on the 360° azimuth (no center sonde was requested). The precipitation on the outbound leg was predominantly stratiform, with echo tops around 10-11 km. The peak FL wind was 74 kt, while the peak surface wind from SFMR was 55 kt (Fig. 8), both observed near the end of the outbound leg (Fig. 7). The strongest winds were consistently observed at the edges of the pattern throughout the mission. The extrapolated MSLP was 975 mb.

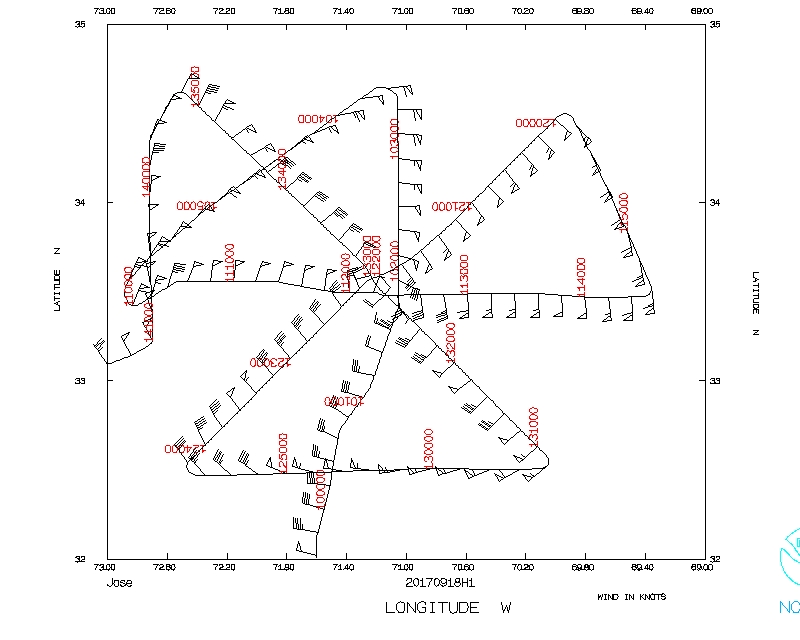
Figure 7. Actual flight track for mission 20170918H1. Flight-level winds (barbs) and wind speeds (shaded, kt) indicated. |
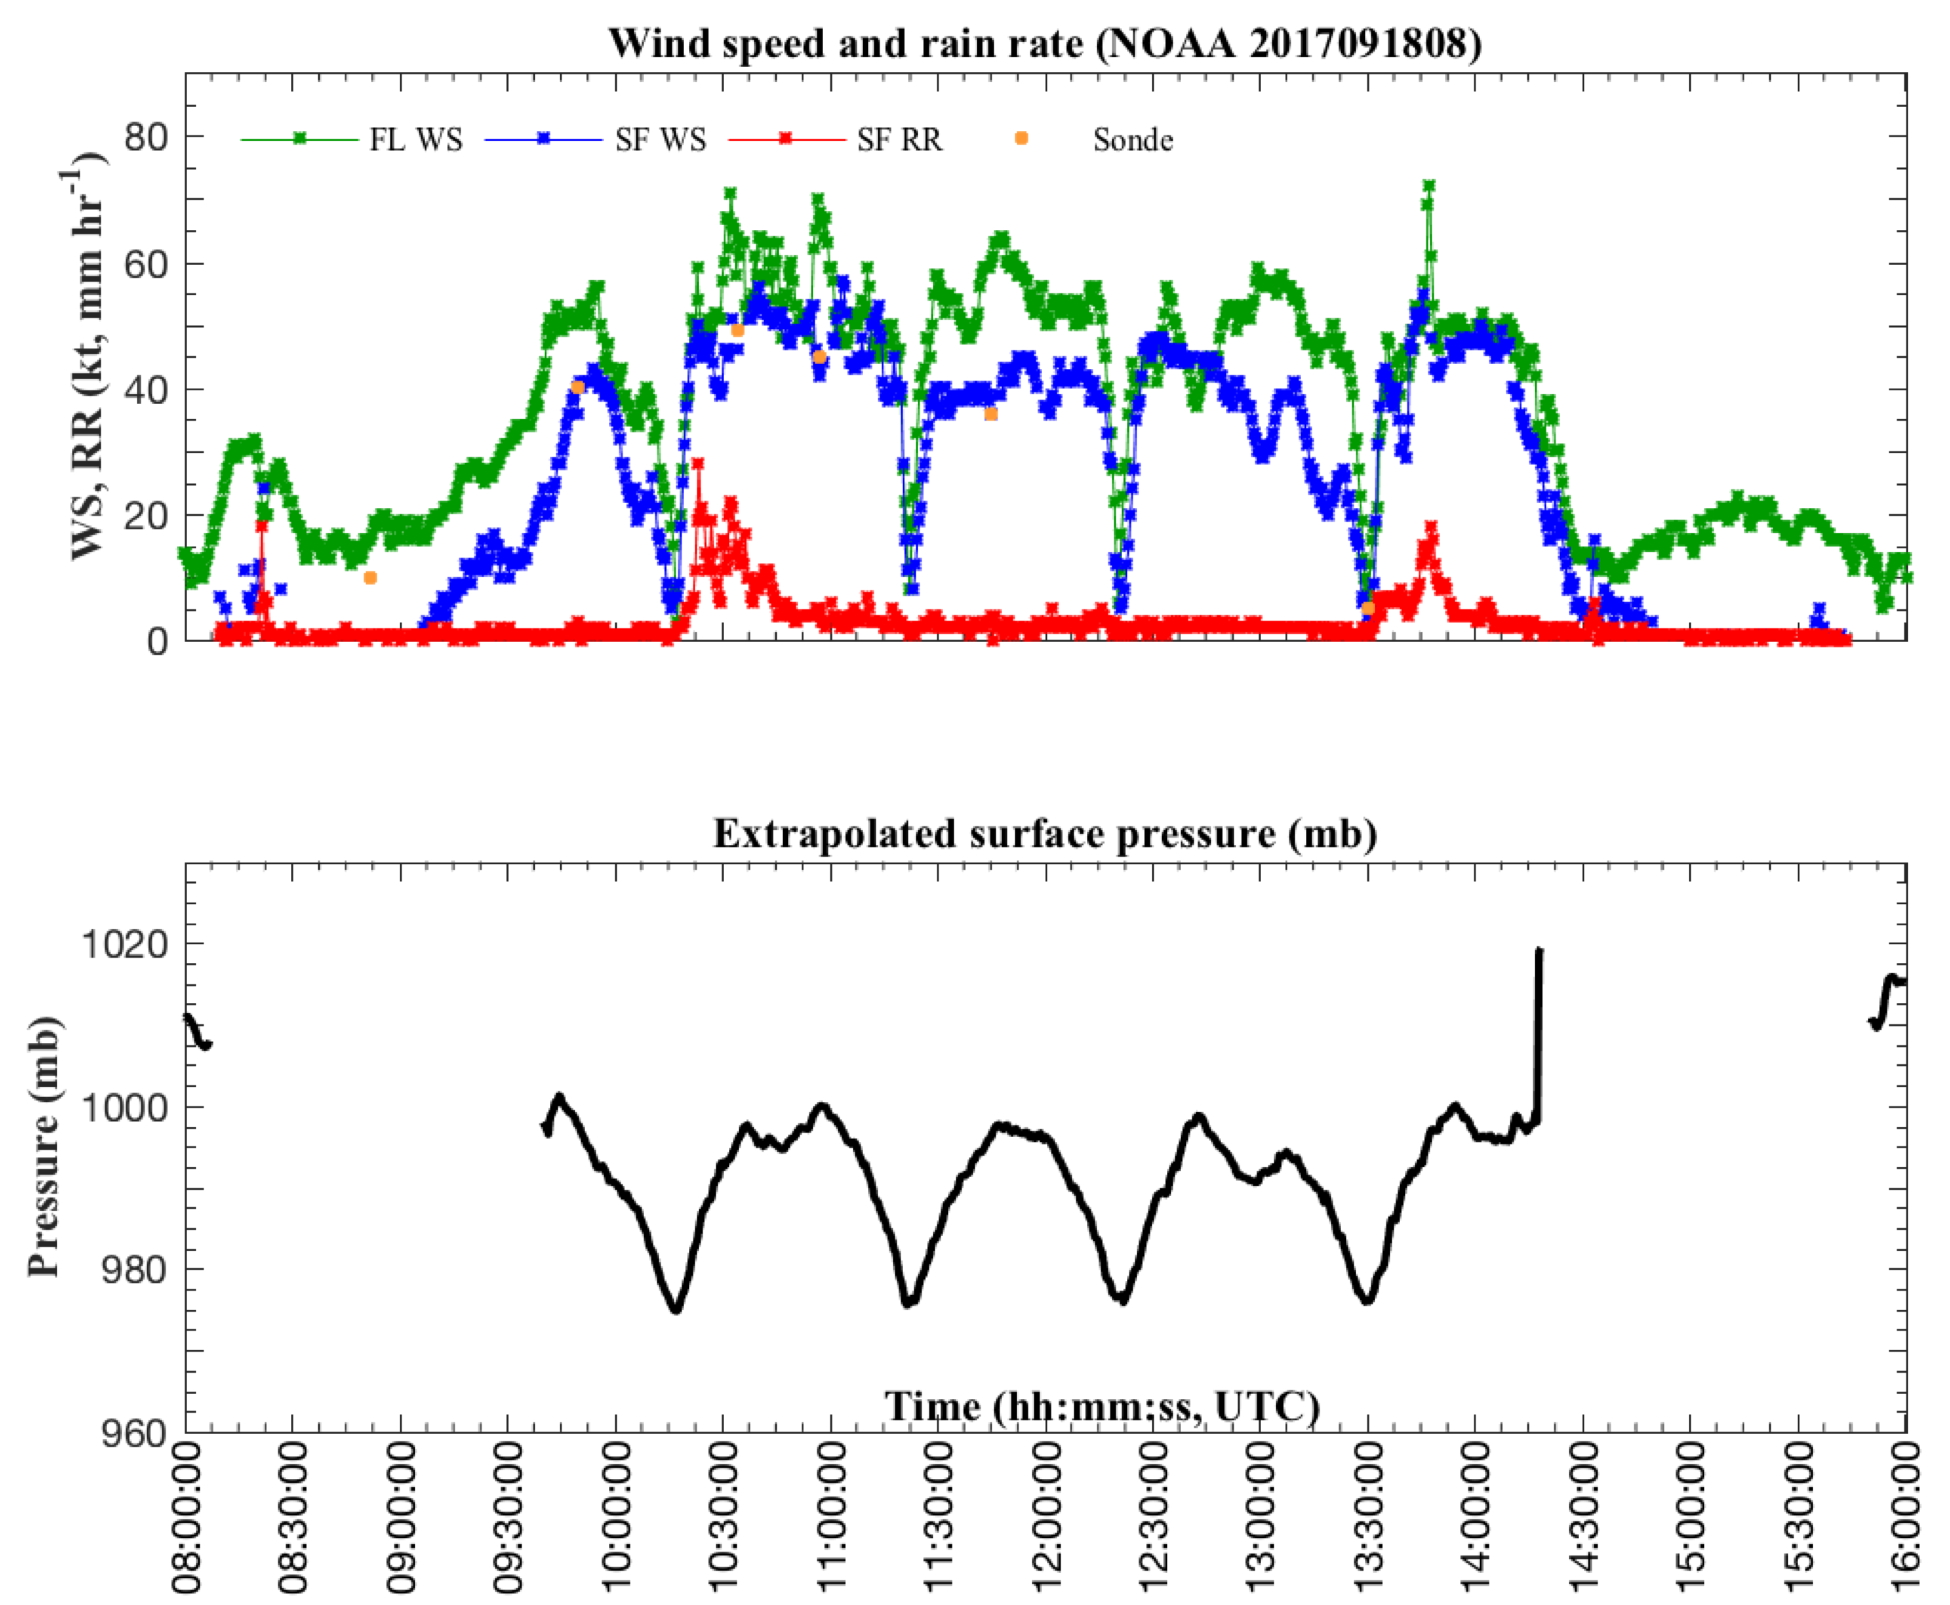
Figure 8. Time series of flight-level winds (green, kt), SFMR surface winds (blue, kt), and SFMR rain rate (red, mm/hr) for mission 20170918H1, as well as the extrapolated surface pressure (mb). |
The outbound leg to the north had to be cut short to about 70 nm due to an airspace issue near the position of WP #2. We arrived at the new WP #2 at 1034 UTC (Sonde #3) and turned downwind for WP #3. Predominantly banded stratiform precipitation was observed on the downwind leg. This concluded the first TDR analysis, which required truncation on the initial inbound from the south due to a lack of scatterers (and potential for noise) (Fig. 11). We arrived at WP #3 at 1057 UTC (Sonde #4) and turned inbound on the 270° azimuth. We fixed the center for a second time at 1122 UTC near 33°29'N / 71°10'W (no sonde requested). Once again, the center was exposed with only shallow cumulus and stratus layers below FL (LF imagery, Fig. 12, and IR imagery, Fig. 13, near the time of the center pass).
While the precipitation (deep convection) to the north of the center appeared more intense on this pass (Fig. 12), the shallow cloud conditions persisted on the outbound on the 090° radial with clear conditions above. The peak surface winds were 58 kt and 70 kt at FL (Fig. 8) on the inbound leg, again maximized near the beginning of the leg, about 90 nm from the center.
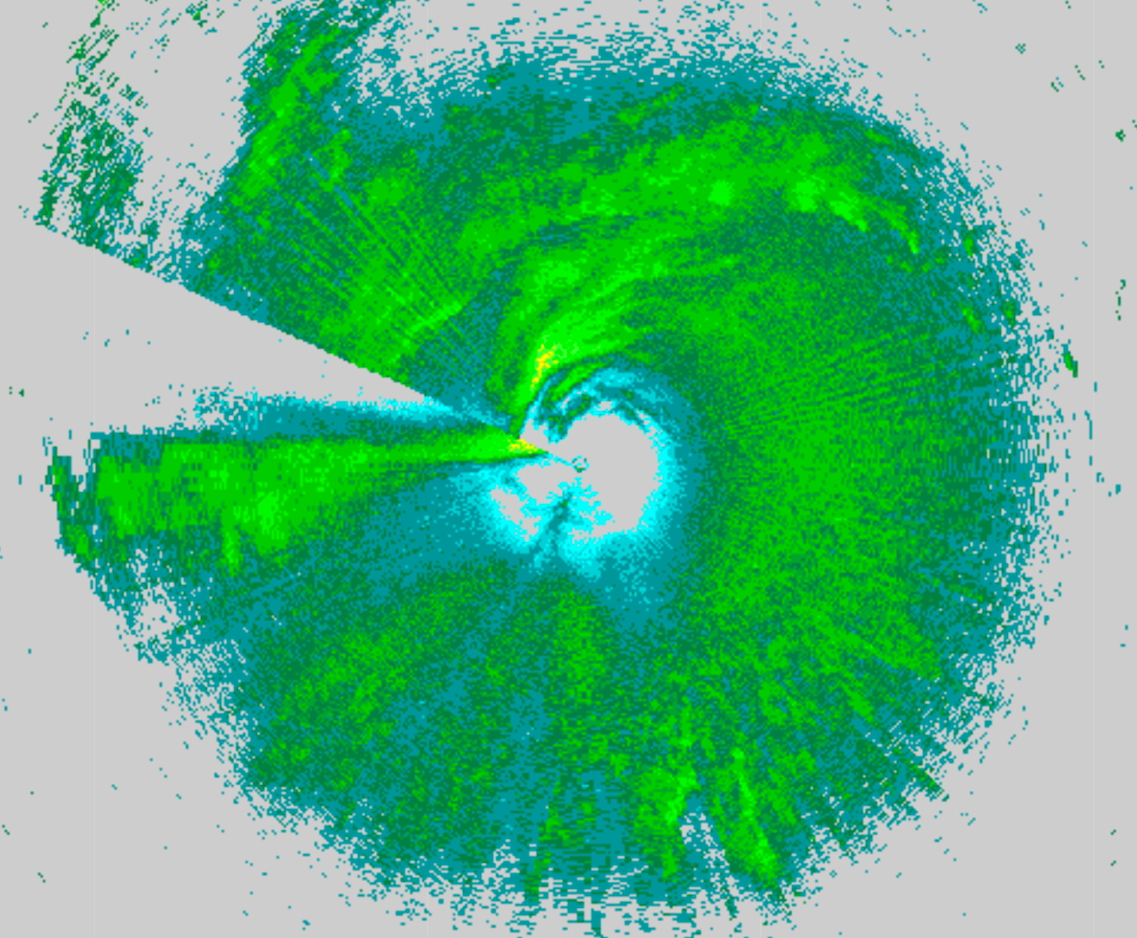
Figure 9. LF imagery at 1017 UTC 18 September |

Figure 10. IR imagery at 1030 UTC 18 September, around the time of the first center pass (image courtesy the Naval Research Laboratory, nrlmry.navy.mil/TC.html) |
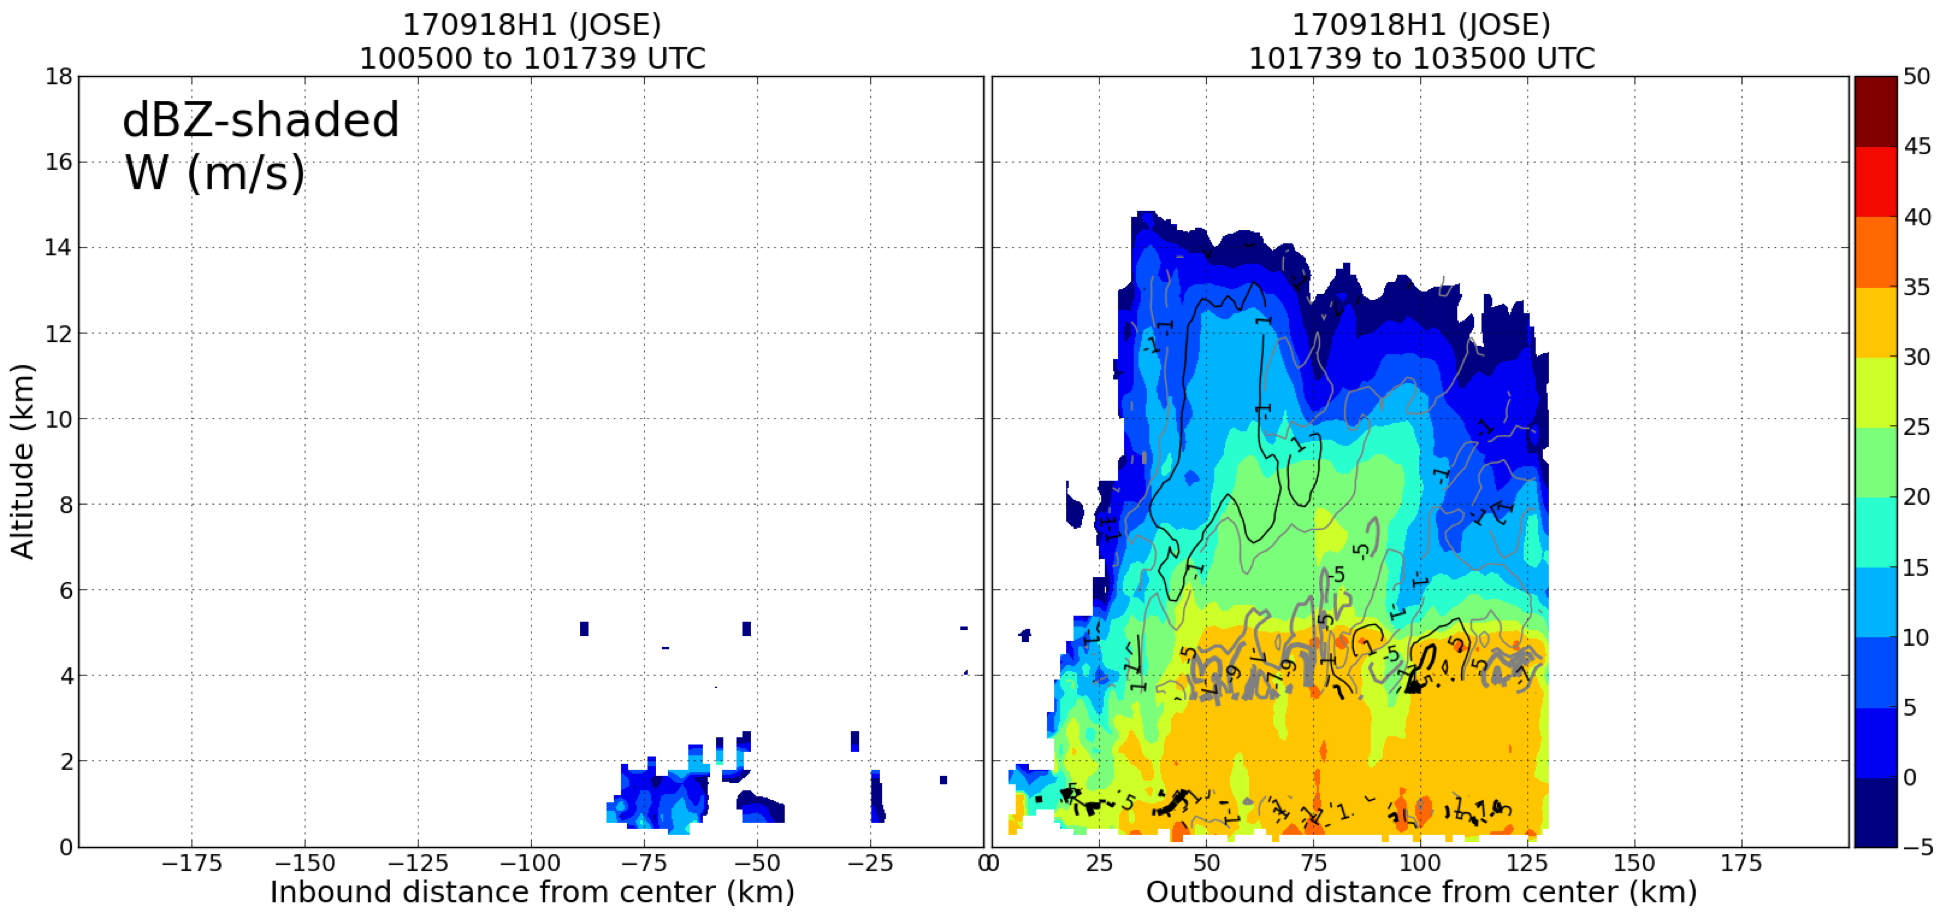
Figure 11. TDR vertical profile analysis of reflectivity (shaded, dBZ) and vertical velocity (contoured, m s-1) for the first pass (between the IP to the S and WP #2 to the N), centered at 1017 UTC. |
We arrived at WP #4 at 1144 UTC (Sonde #5), which completed the first Figure-4, and turned downwind for WP #5. WP #5 marked the end of the second TDR analysis. While there was some noise due to the lack of precipitation on the eastern outbound and downwind, no truncation was done for this analysis (Fig. 14). On the inbound on the 045°, we experienced some anvil blow off from the convective burst occurring NW of the center, but once again the clouds were predominantly not raining (shallow cumulus, stratus topped at and below FL, ~2 km). We fixed the center a third time at 1220 UTC near 33°34'N / 71° 14'W (no sonde) (LF imagery near the center pass time in Fig. 15, and IR imagery in Fig. 16), and continued outbound on the 225° to WP #6 (arrived 1241 UTC) in relatively clear conditions at and above FL. Upon reaching WP #7 downwind, the third TDR analysis was completed (Fig. 17). The downwind leg was truncated from this analysis, and even then there was a lot of noise considering there was very few radar returns on any portion of the pattern contributing to the analysis.
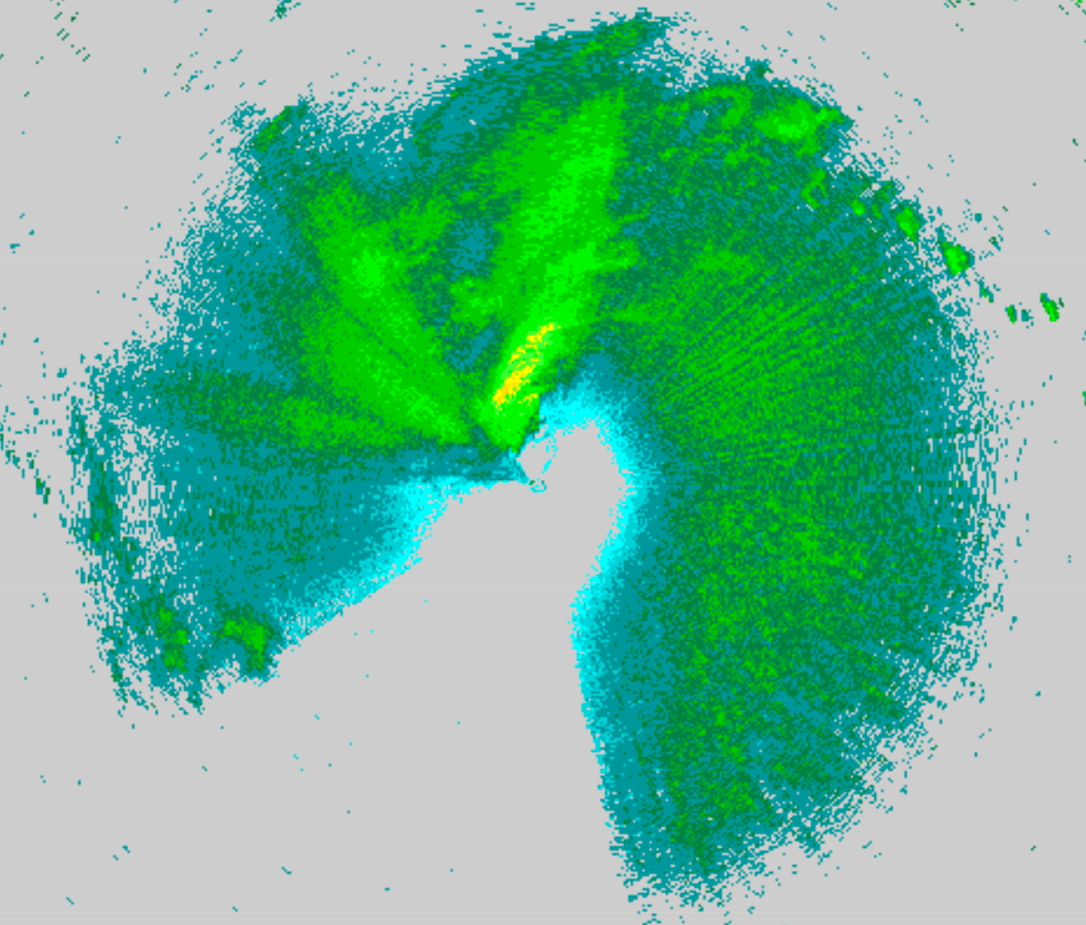
Figure 12. LF imagery at 1122 UTC 18 September |
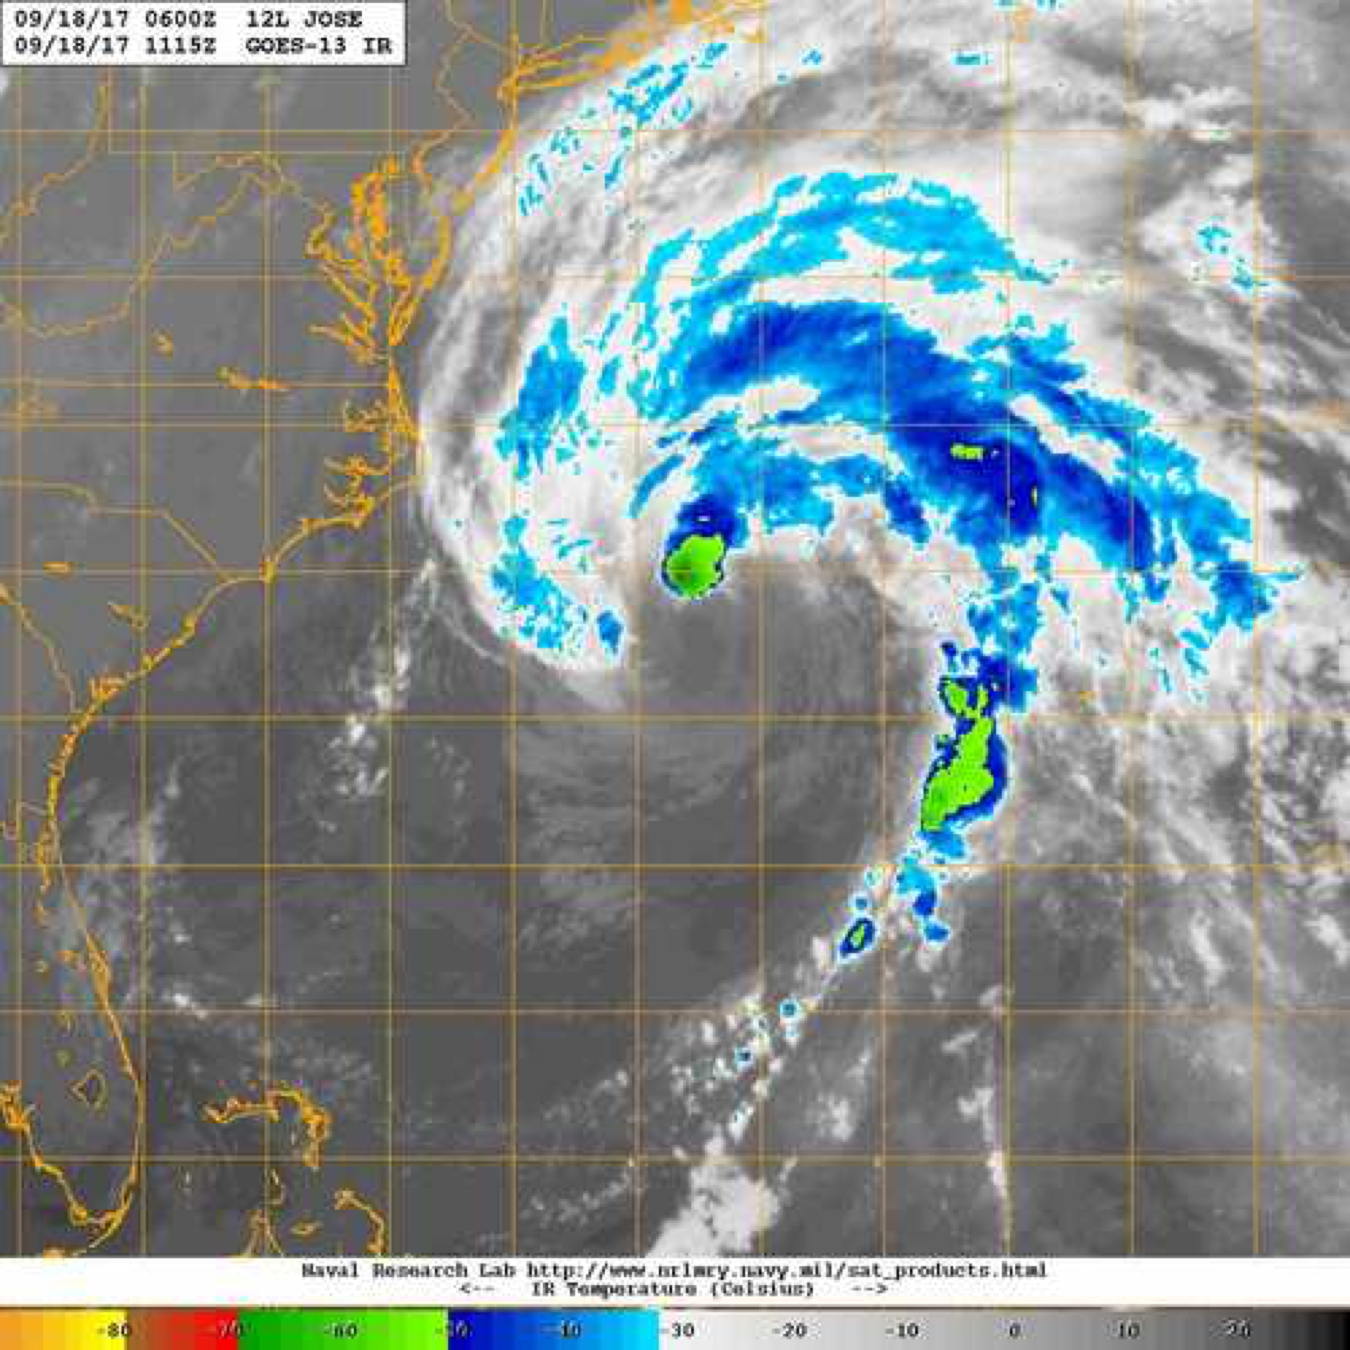
Figure 13. IR imagery at 1115 UTC 18 September, around the time of the second center pass (image courtesy the Naval Research Laboratory, nrlmry.navy.mil/TC.html) |
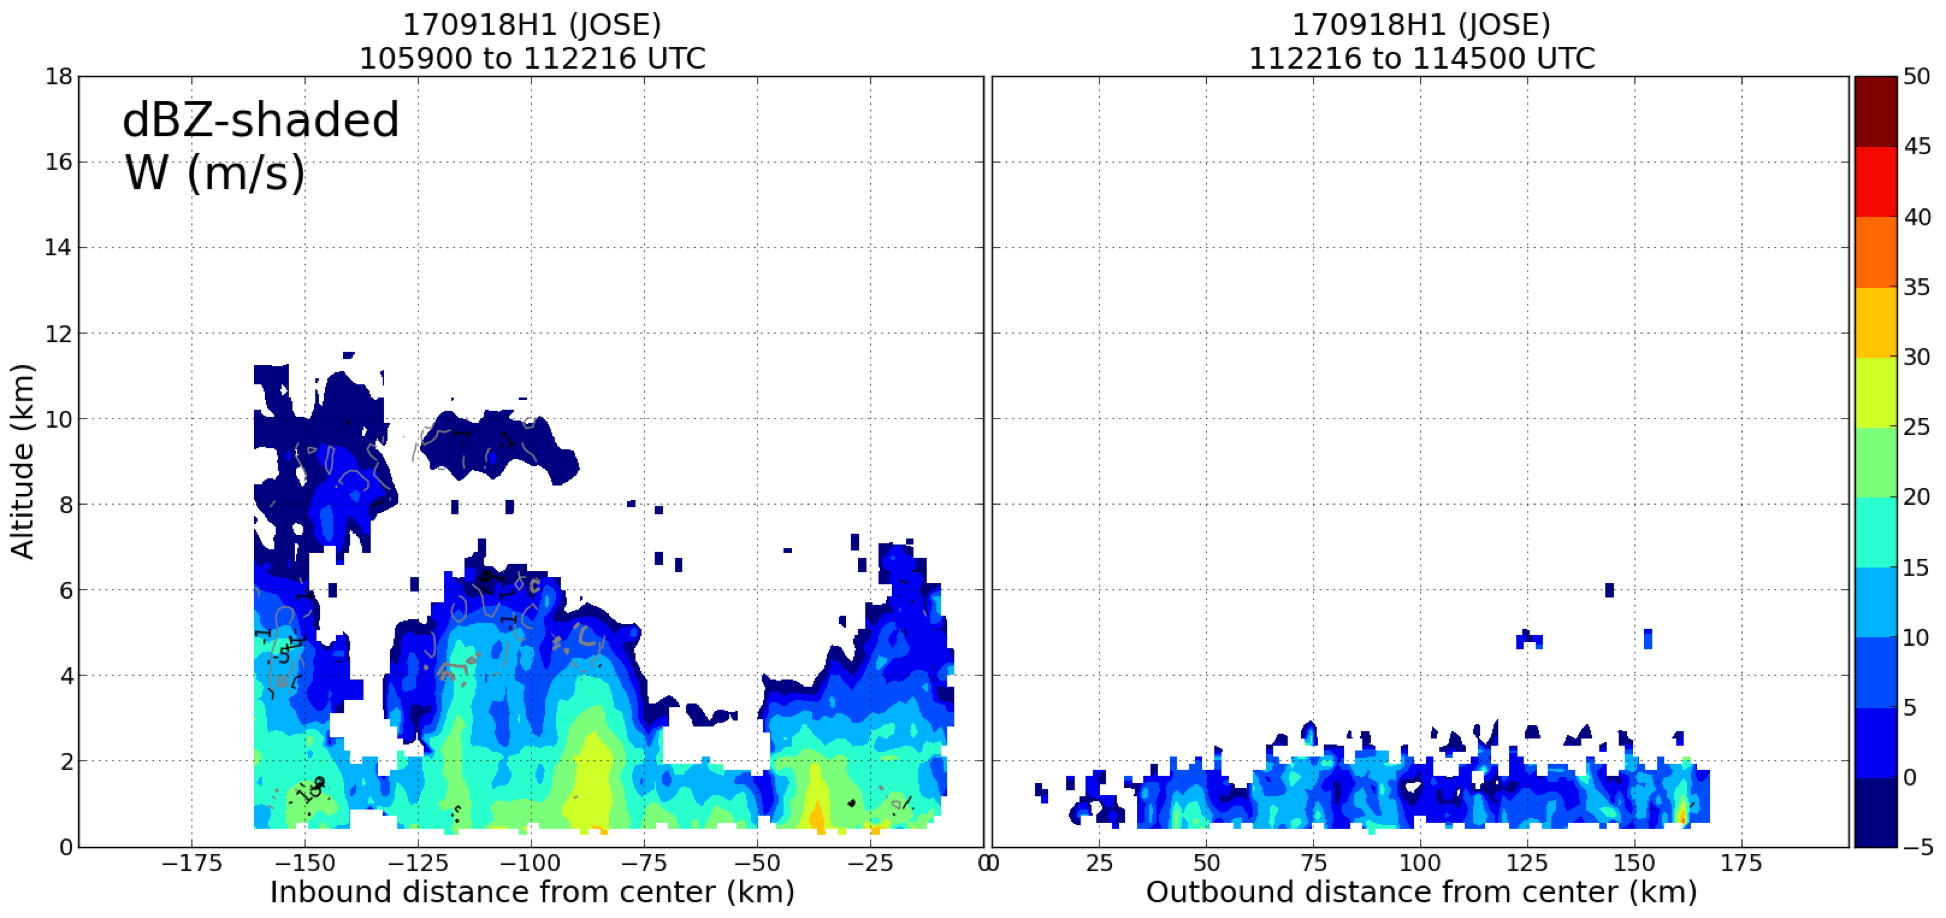
Figure 14. TDR vertical profile analysis of reflectivity (shaded, dBZ) and vertical velocity (contoured, m s-1) for the second pass (between WP #3 to the W and WP #4 to the E), centered at 1122 UTC. |
From WP #7 we went inbound on the 135° azimuth. While the intensity of the deep convection to the NW had waned since earlier passes, the extent of stratiform rain appeared to be increasing in coverage around the western side of the storm, even extending around to the SW near the center (LF imagery, Fig. 18; IR imagery, Fig. 19). We fixed the center at 1330 UTC near 33°36'N / 71°15'W (NHC requested a sonde for this center fix, Sonde #6). The extrapolated surface pressure on this fix was 977.8 mb. We proceeded outbound on the 315° radial, finally passing through the extensive precipitation shield to the NW of the center. Given the extent of the precipitation, we decided to remain at altitude after passing through WP #8 (completing the second Figure-4) as we began our ferry back to Lakeland. This improvised downwind leg initially was 210°, then to parallel a rainband was changed to a heading of 180°. This provided another ~90 nm of coverage and was included in the fourth TDR analysis (Fig. 20). While the inbound leg from the SE was truncated to the 15 nm from the center, the remainder of the analysis looked good.
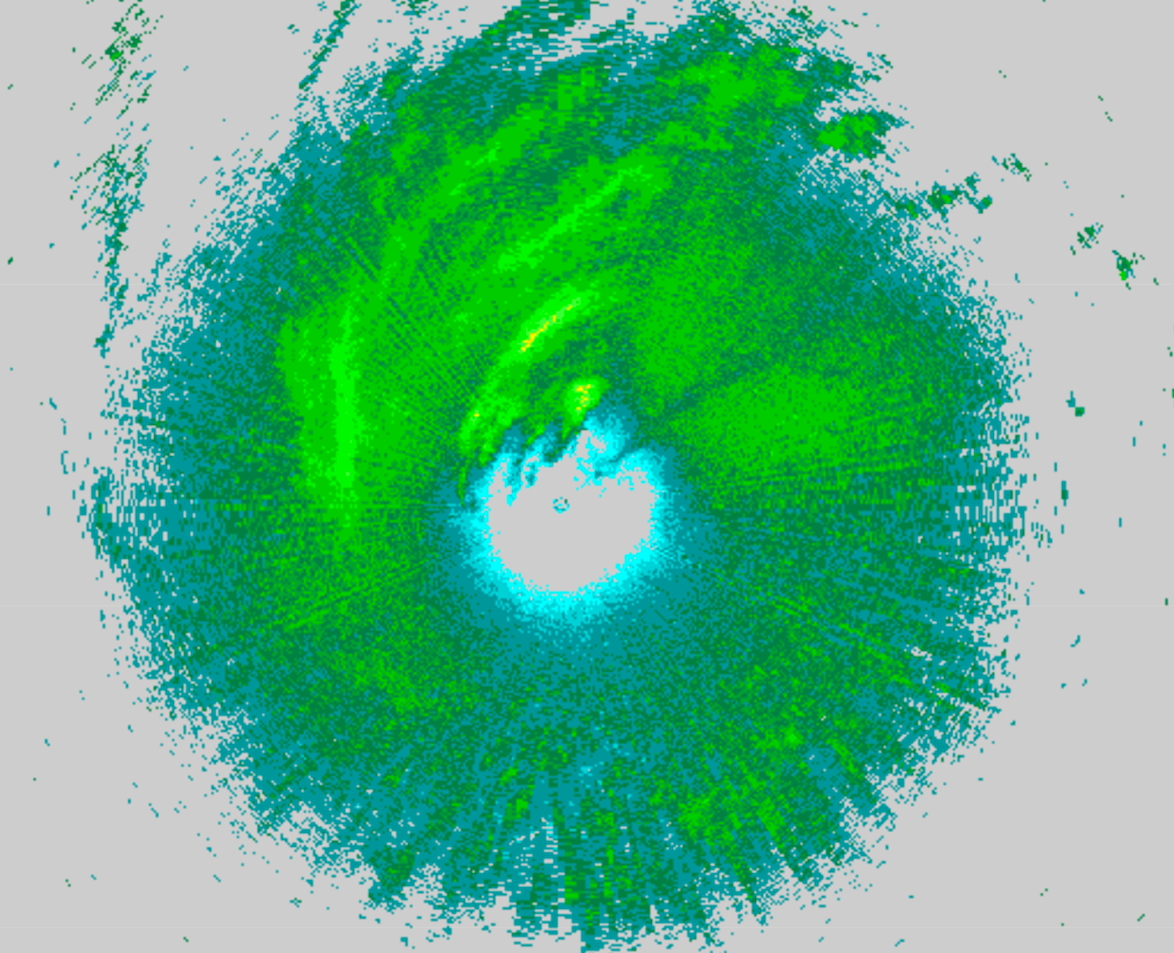
Figure 15. LF imagery at 1222 UTC 18 September |
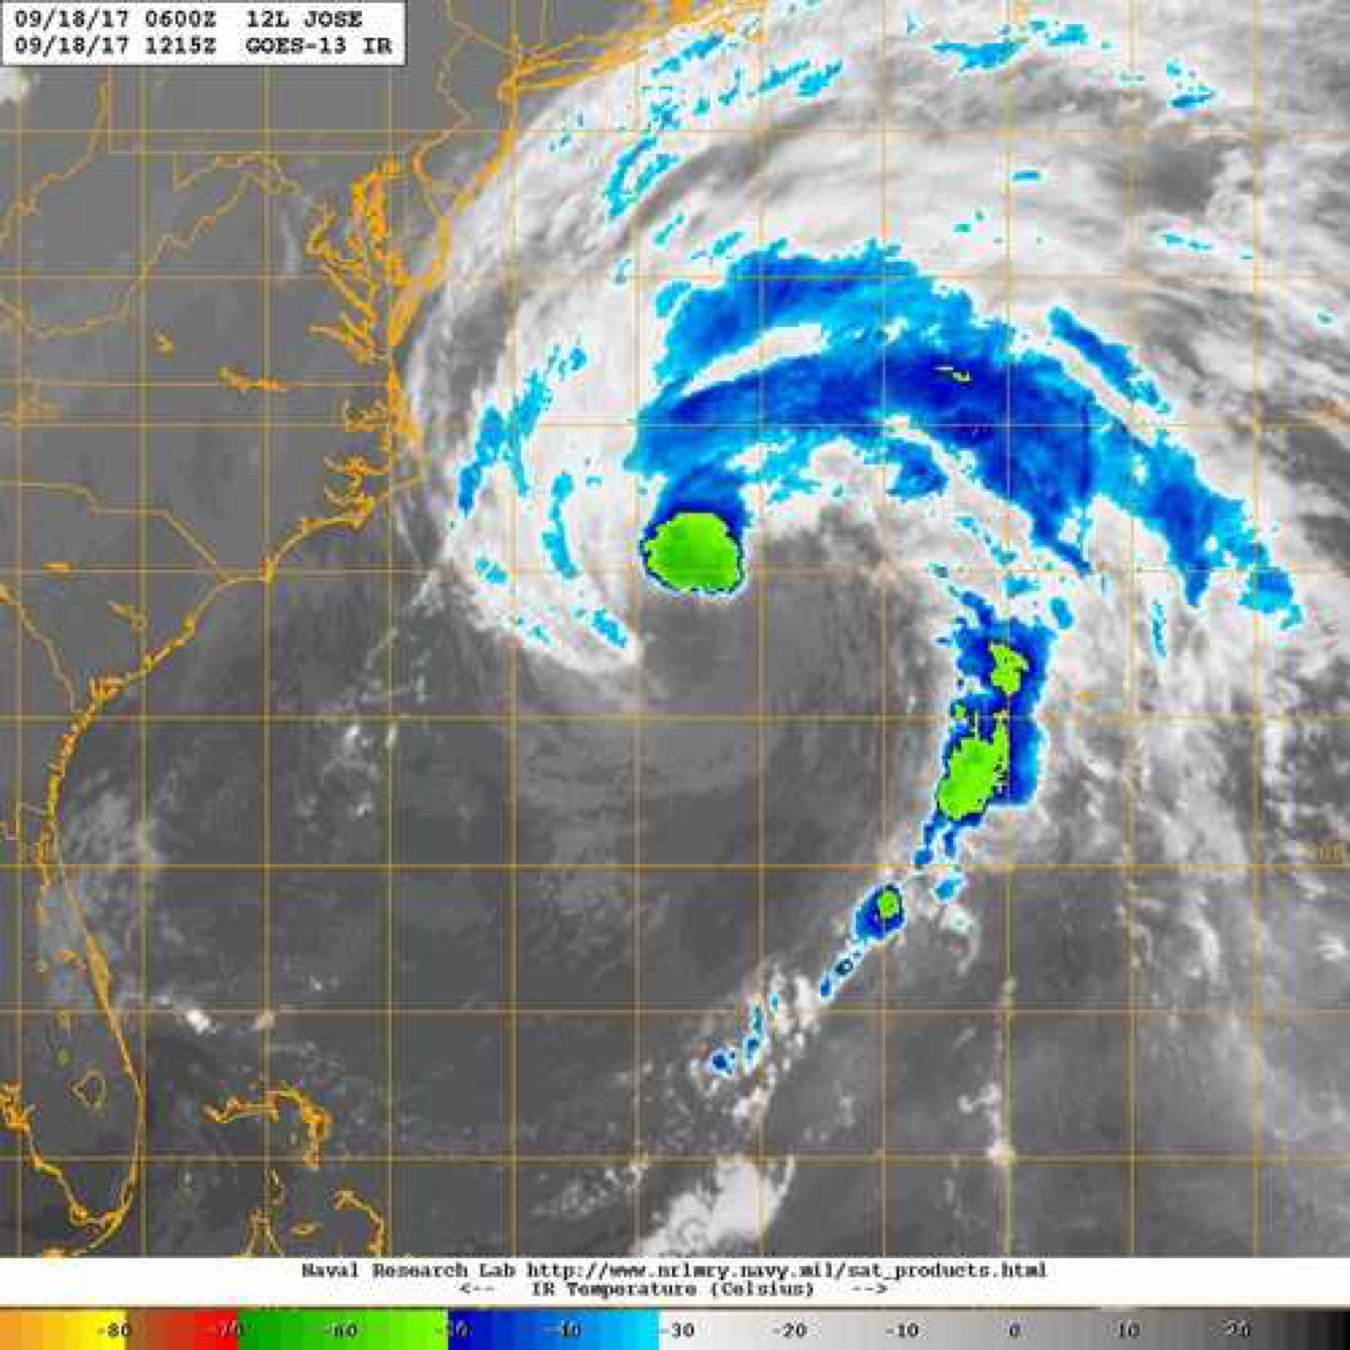
Figure 16. IR imagery at 1215 UTC 18 September, around the time of the third center pass (image courtesy the Naval Research Laboratory, nrlmry.navy.mil/TC.html) |
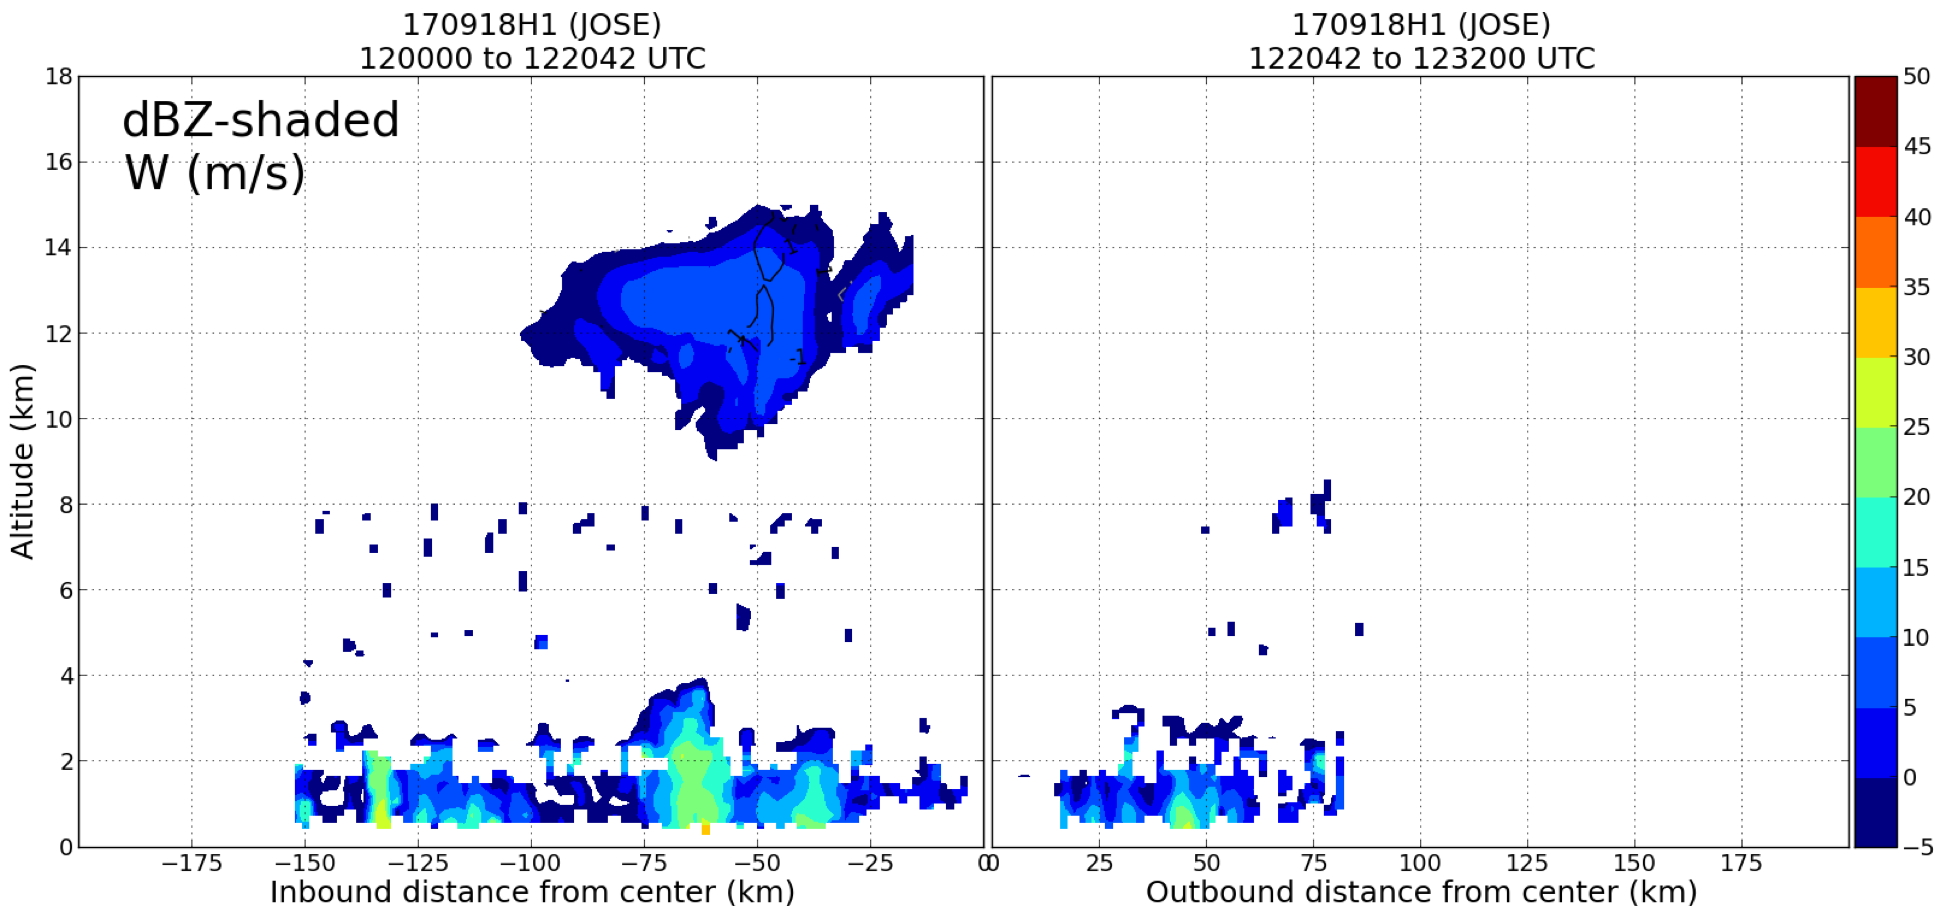
Figure 17. TDR vertical profile analysis of reflectivity (shaded, dBZ) and vertical velocity (contoured, m s-1) for the third pass (between WP #5 to the NE and WP #6 to the SW), centered at 1220 UTC. |
Mission Evaluation/Problems :
Hurricane Jose was gradually weakening during the mission as the MSLP prior to takeoff was 972 mb (according to the 0600 UTC NHC advisory), while on the final pass the extrapolated and center dropsonde surface pressure was 977 mb (the 1500 UTC NHC advisory was also 977 mb). And while Jose was 75 kt at the beginning of the mission, peak SFMR observations from the mission were 58 kt. Combined with Teal observations, by the end of the mission NHC had lowered the intensity to 65 kt. The peak FL wind was 70 kt. It's apparent that the lack of deep convection around the center, a consequence of the dry air intrusion (and subsidence) into the inner core from the strong deep-layer vertical wind shear, was contributing towards weakening the vortex. The strongest winds were not observed near the center either; they were out at 80-90 nm, or near the endpoints of the pattern.
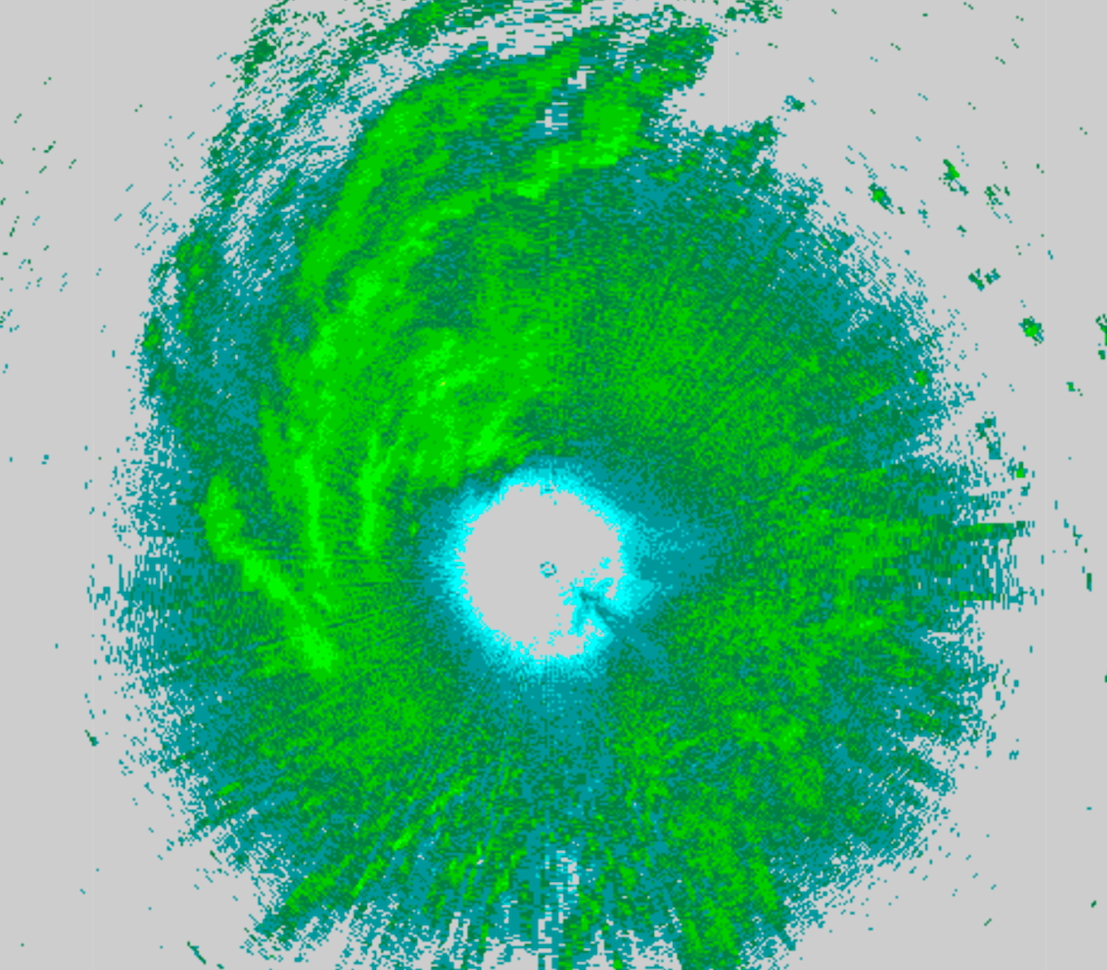
Figure 18. LF imagery at 1327 UTC 18 September |
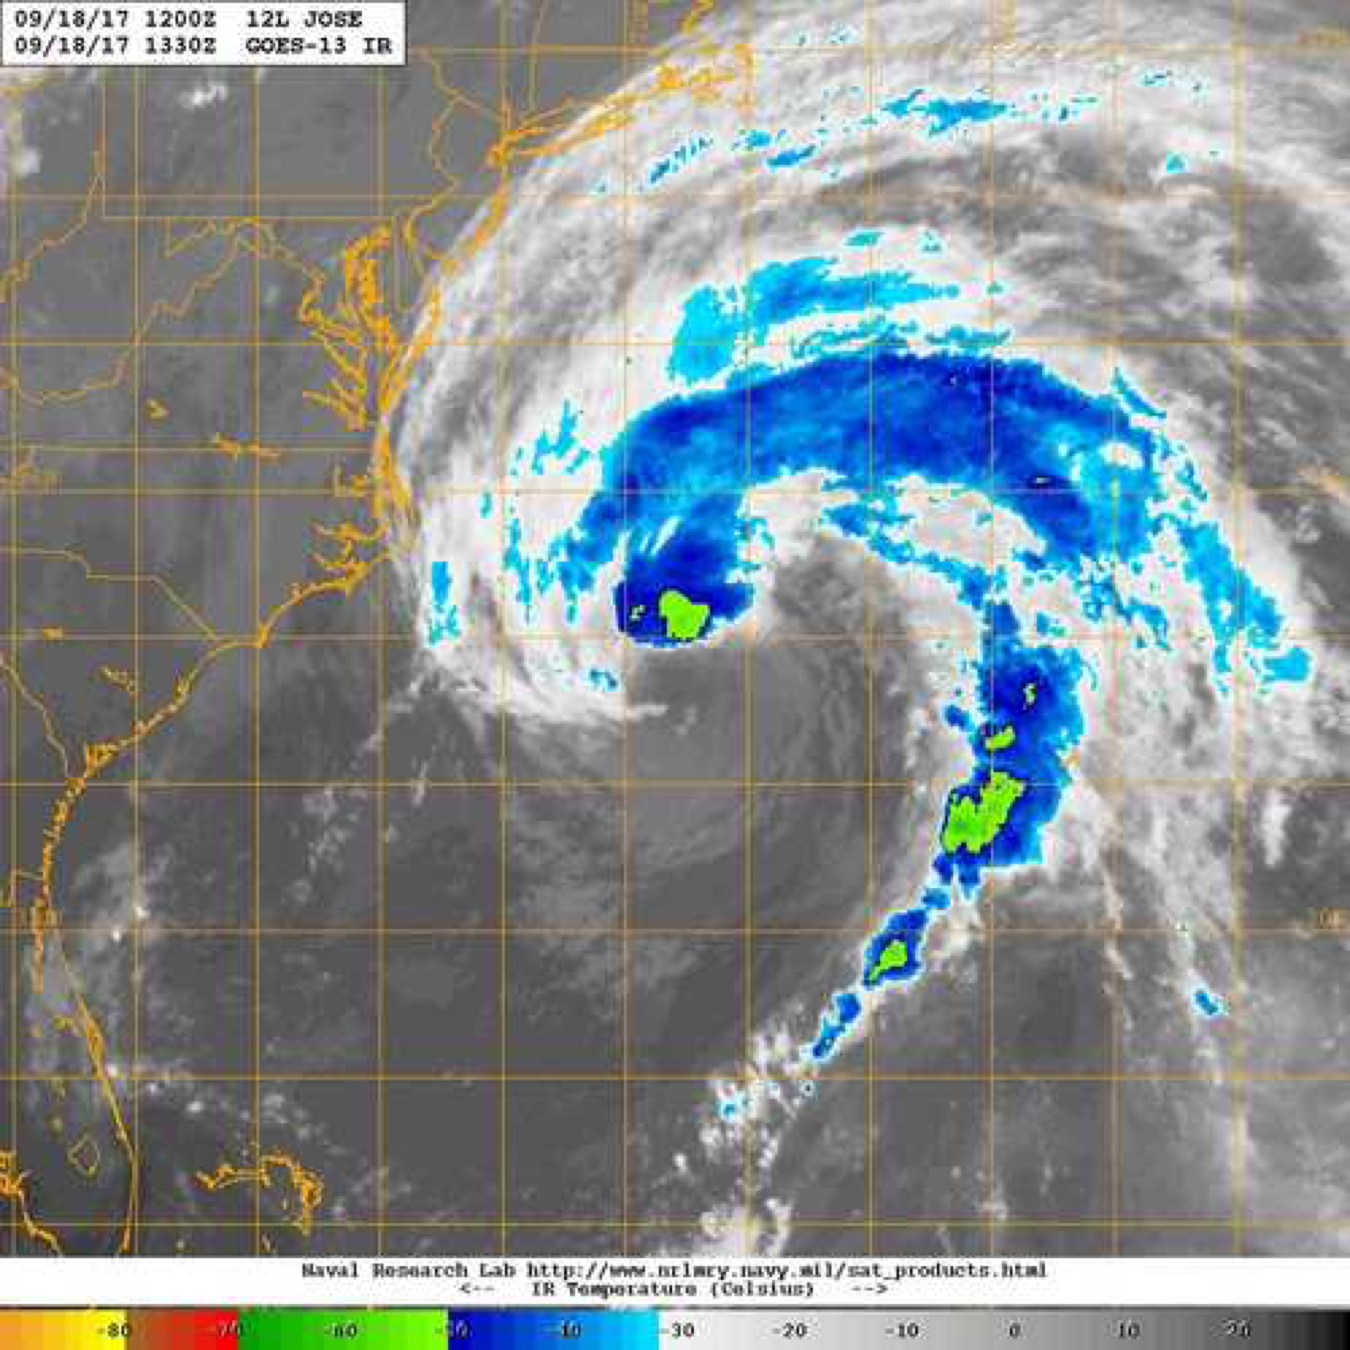
Figure 19. IR imagery at 1330 UTC 18 September, around the time of the fourth and final center pass (image courtesy the Naval Research Laboratory, nrlmry.navy.mil/TC.html) |
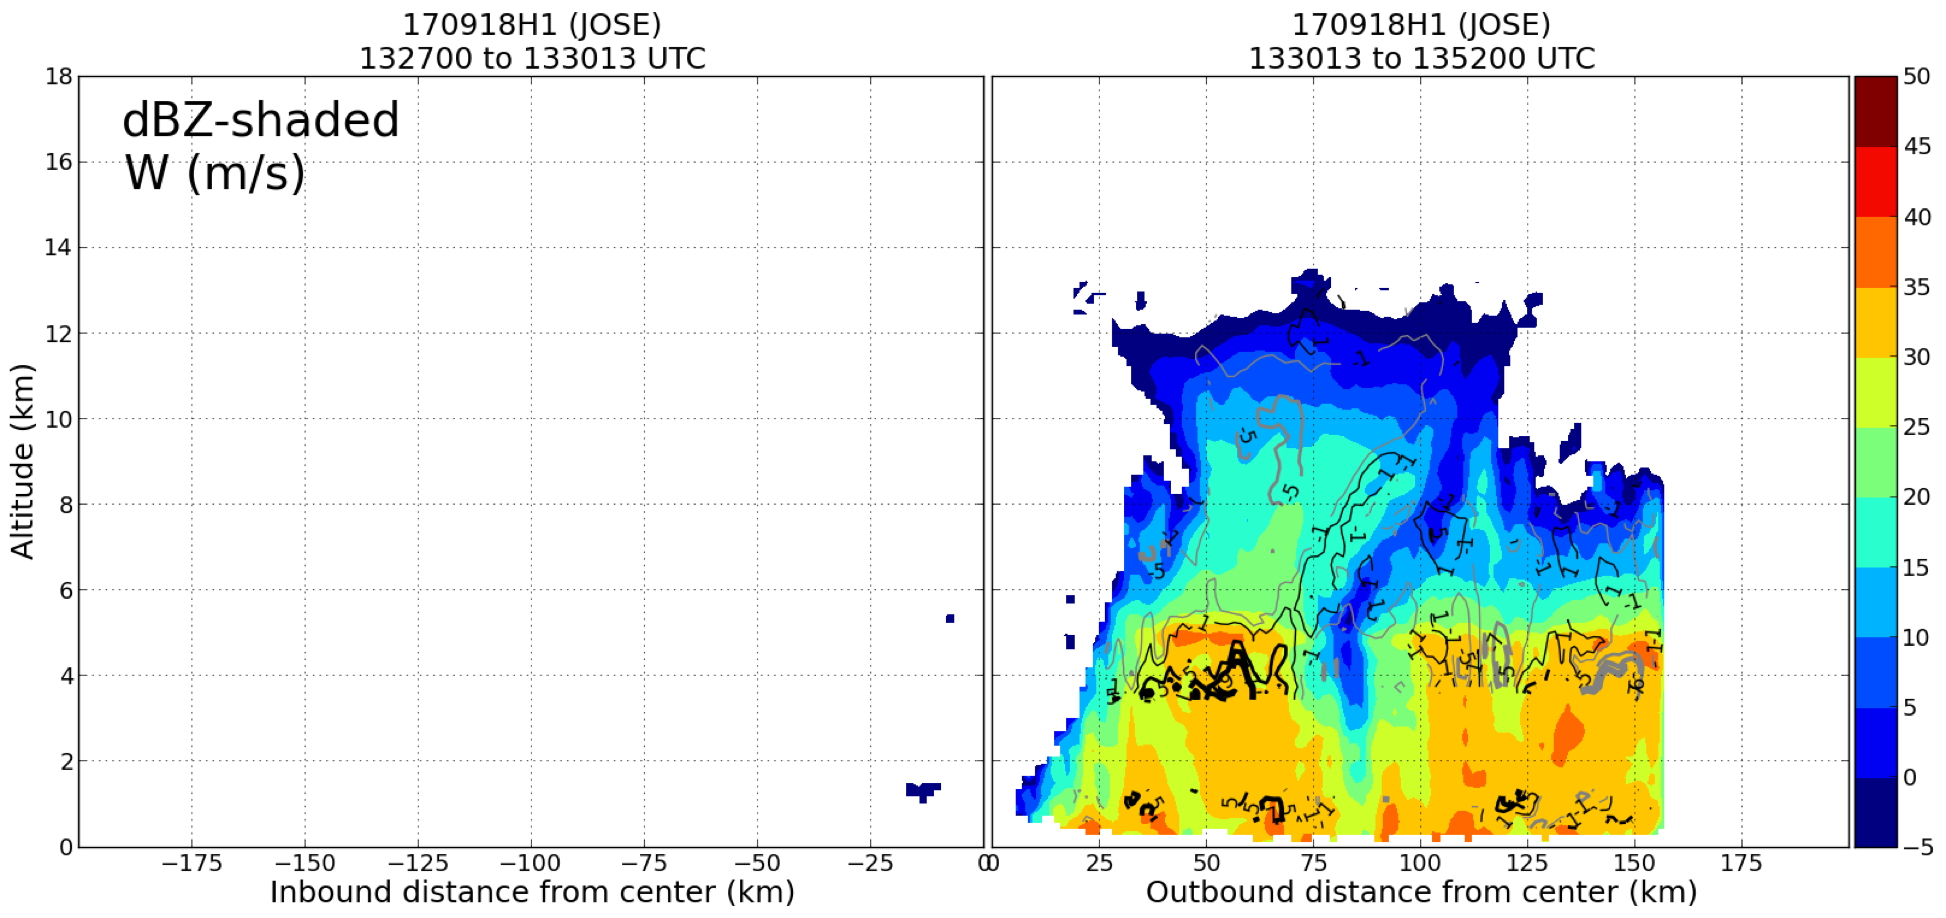
Figure 20. TDR vertical profile analysis of reflectivity (shaded, dBZ) and vertical velocity (contoured, m s-1) for the fourth and final pass (between WP #7 to the SE and WP #8 to the NW), centered at 1330 UTC. |
Four TDR analyses were produced and transmitted to EMC. The altitude was 8 kft pressure for the entire mission. In the first analysis, the inbound was truncated to avoid noise in the analysis given the lack of precipitation. As the outbound and subsequent was to the N, plenty of precipitation contributed to a good analysis in that portion of the pattern. On the second analysis (W to E, and downwind to the NE waypoint), decent precipitation coverage was observed on the inbound from the W; however, a lack of rain on the outbound to the E and subsequent downwind produced some noise. The third analysis (from the NE to SW, and downwind to the SE) produced the noisiest analysis; very little precipitating cloud was observed at any altitude in this part of the pattern. Only occasional remnant light anvil precipitation, as well as some shallow cumulus/stratus (tops 2 km and below) producing 25, 30 dBZ max were observed (this type of clouds/precipitation conditions were prevalent in most of the "clear' quadrants of the storm). The downwind was not included in the third analysis. The fourth analysis was truncated to about 15 nmi from the center on the inbound to the center from the SE, and complete for the outbound and the subsequent downwind (to the S) flown through the precipitation to the W of the center.
Overall, other than for the lack of scatterers, the TDR performed nominally and the mission objectives were met (TDR, drops transmitted to EMC). Each of the 6 sondes also produced good data. The DWL appeared to collect data, but only in a fixed scan. The DWL was not scanning for most of the mission. There was also difficulty using the DWL laptop at Station 2 without it powering off, therefore it had to be operated with a direct line to the system.
Jon Zawislak
Sept. 21, 2017
| NetCDF SFMR data | |
Timeseries wind, rain rate, and pressure plots |
|
Flight level wind plots full flight |
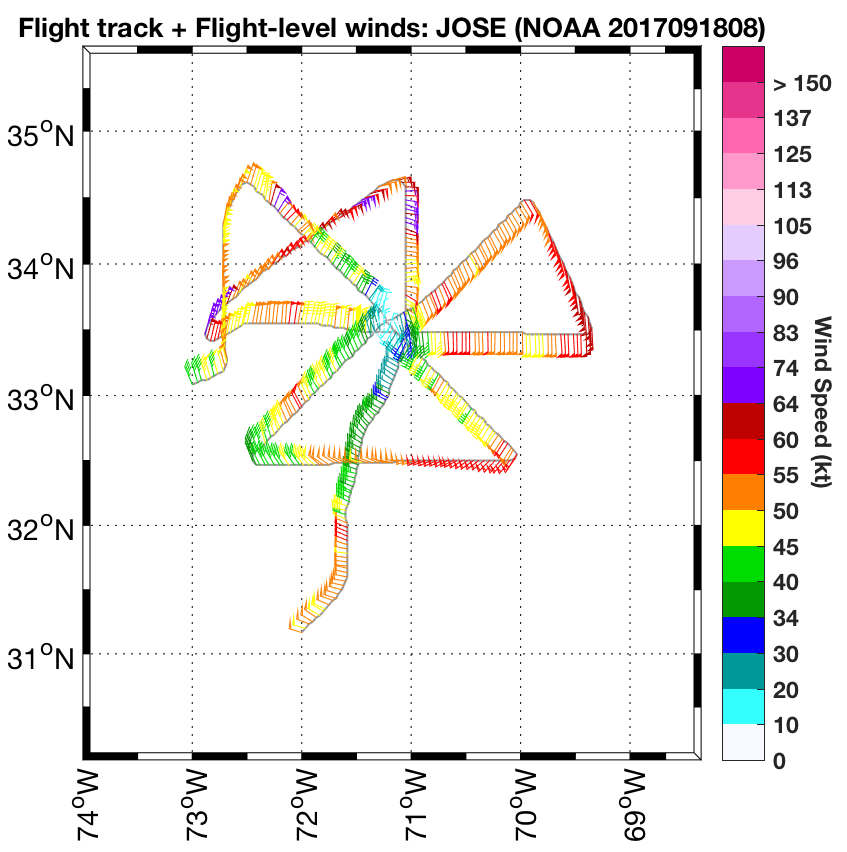
Flight level wind plots in storm |
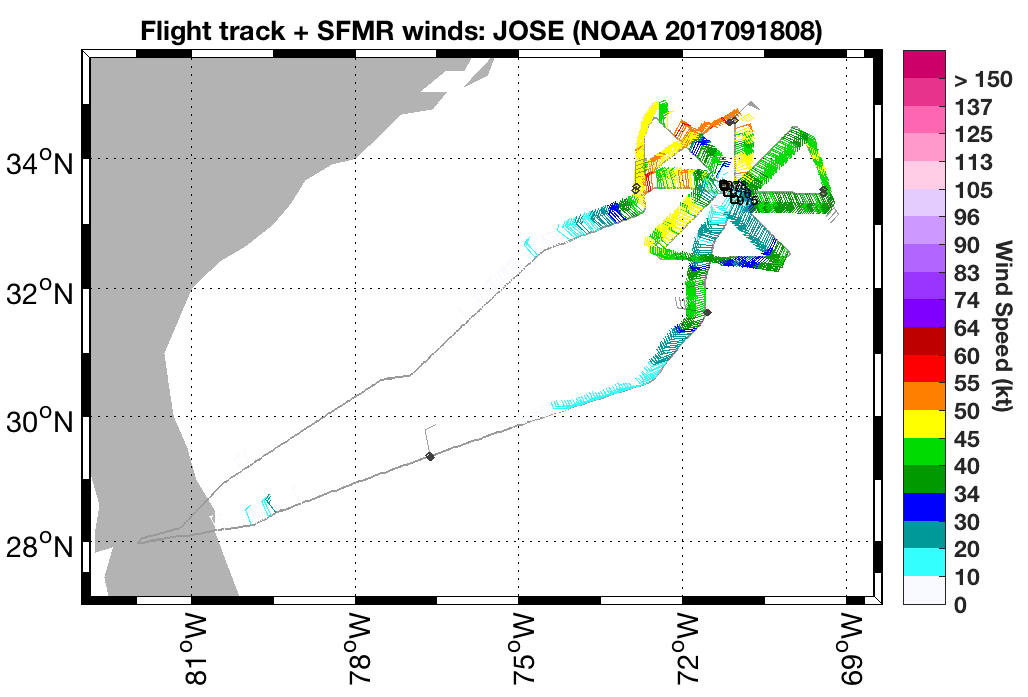
SFMR wind plots full flight |
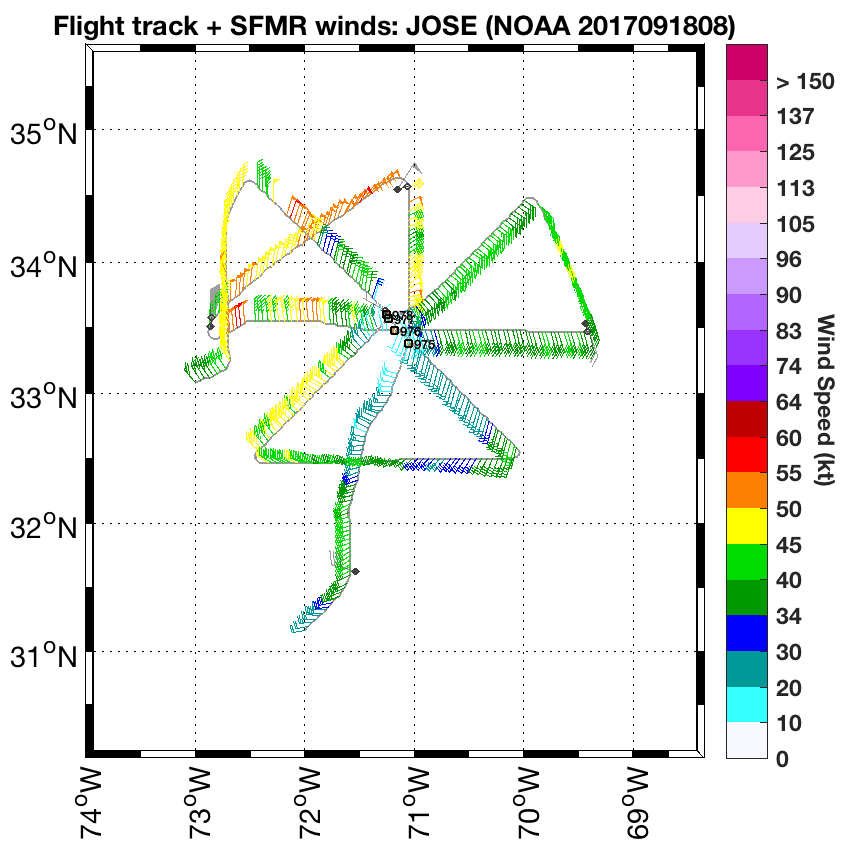
SFMR wind plots in storm |
 Flight track |
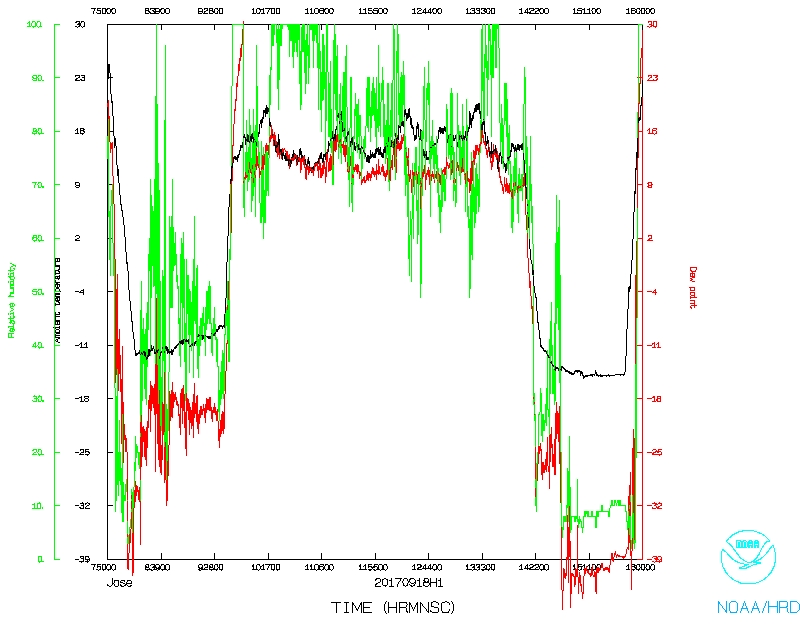 Temperature and Moisture |
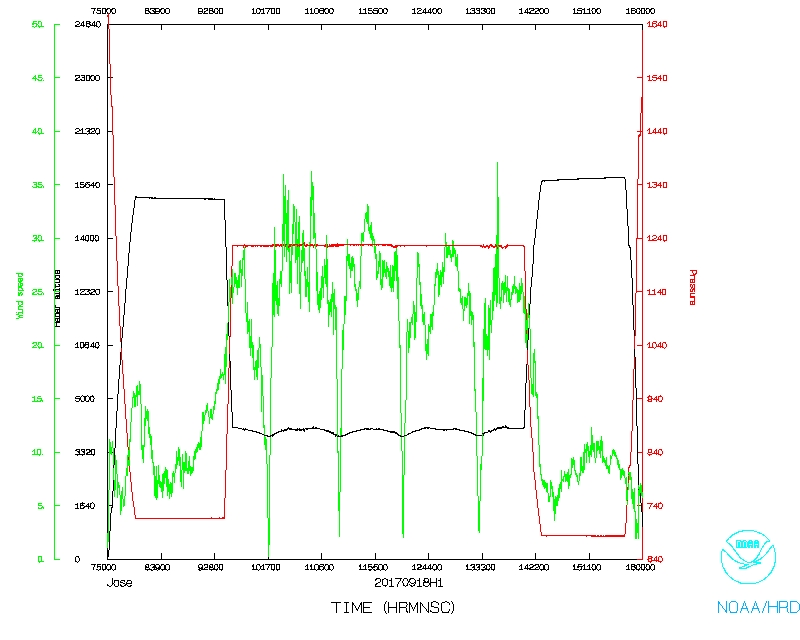 Wind and Atlitude |
 Flight track detail |
LPS log |
Radar log |
Drop log
Flight Director's manifest
Flight Director's log |
NetCDF data |
serial data |
1 second data