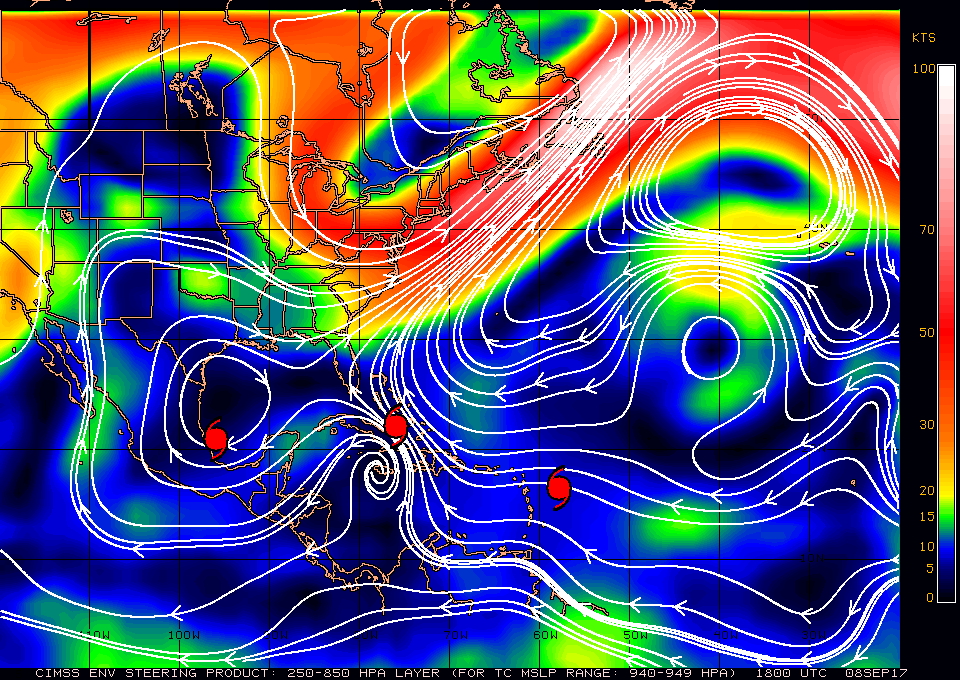
Figure 1. Deep-layer steering winds 250-850 hPa. 1800 Z Sep 8, 2017 (CIMMS) |
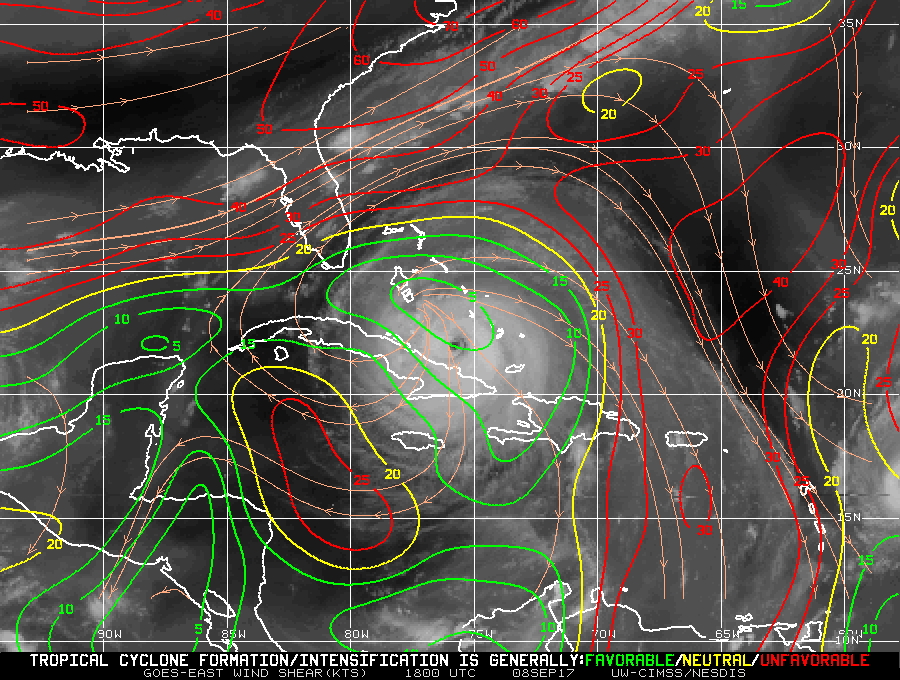
Figure 2. Wind shear (kt) 1800 Z Sep 8, 2017 (CIMMS) |
| Aircraft Commander | Scott Price |
| Co-pilot | Mitchell |
| Co-pilot | Ruckman |
| Flight Engineer | Paul Darby |
| Flight Engineer | Chris Tuffnel |
| Navigator | Sloan |
| Navigator | Urato |
| Flight Director | Jack Parrish |
| Flight Director | Brian Belson |
| System Engineer | Jim Warnecke |
| Data Technician | Mike Mascaro |
| Dropsonde Operator | Michael McAlister |
| Lead Project/Radar Scientist | Lisa Bucci | HRD |
| Dropsonde Scientist | Brad Klotz | HRD |
| Guest | Joseph Roetz | WSVN |
| Guest | Julio Jara | WSVN |
| Radar Scientist | Paul Reasor | HRD |
Mission Plan :
|
Figure 1. Deep-layer steering winds 250-850 hPa. 1800 Z Sep 8, 2017 (CIMMS) |
Figure 2. Wind shear (kt) 1800 Z Sep 8, 2017 (CIMMS) |
The mission is to conduct an EMC-tasked TDR experiment into Hurricane Irma. The category 4 hurricane was located the north coast of Cuba in the Florida Straits. It is moving W at about 12 knots (Figure 1). Low shear (Figure 2) and warm SSTs provide a favorable environment for Irma to maintain or even strengthen if the circulation remains off shore. Irma has just completed an eye wall replacement cycle. Track guidance show Irma approaching grazing the coast of Cuba before making a northward turn towards the Florida Keys and west coast of Florida (Figure 3). Intensity guidance initializes Irma as a category 4 hurricane and maintains this intensity (possibly slightly strengthening to a category 5) for 48 hours until landfall in the Florida peninsula (Figure 4).
The plan calls for a rotated Figure-4 butterfly with the southern legs shortened to avoid Cuban air space (Figure 5a). Flight altitude is at 10000 feet radar with paired IR/AXBT drops at the mid and end points. NHC requested drops for each pass through the center. A reorientation of the last pass is possible to match a CYGNSS overpass for future instrument comparison. Upon completion of the mission, the plane will return to Linder Lakeland Airport.
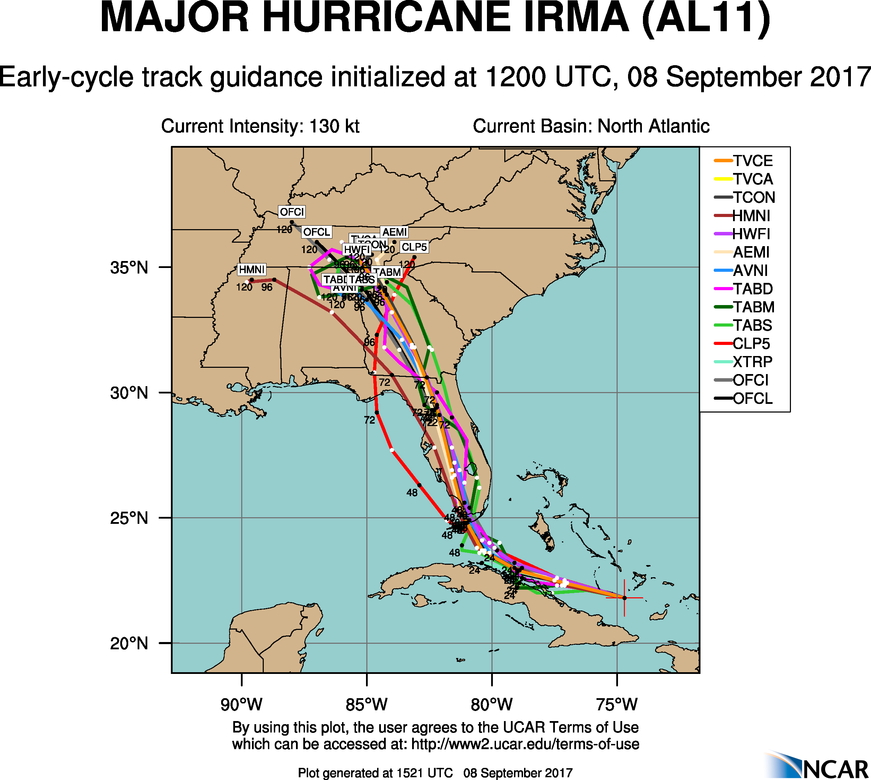
Figure 3. Early-cycle Track forecasts for Irma 1521 Z Sep 8, 2017 (NCAR) |

Figure 4. Early-cycle Intensity forecasts for Irma 1522 Z Sep 8, 2017 (NCAR) |
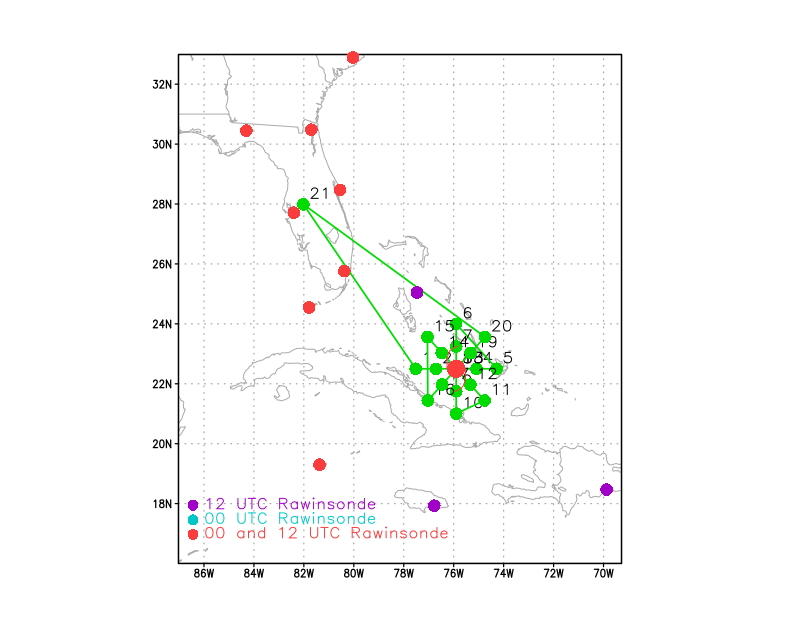
Figure 5a. Proposed flight track for 20170908H2 |
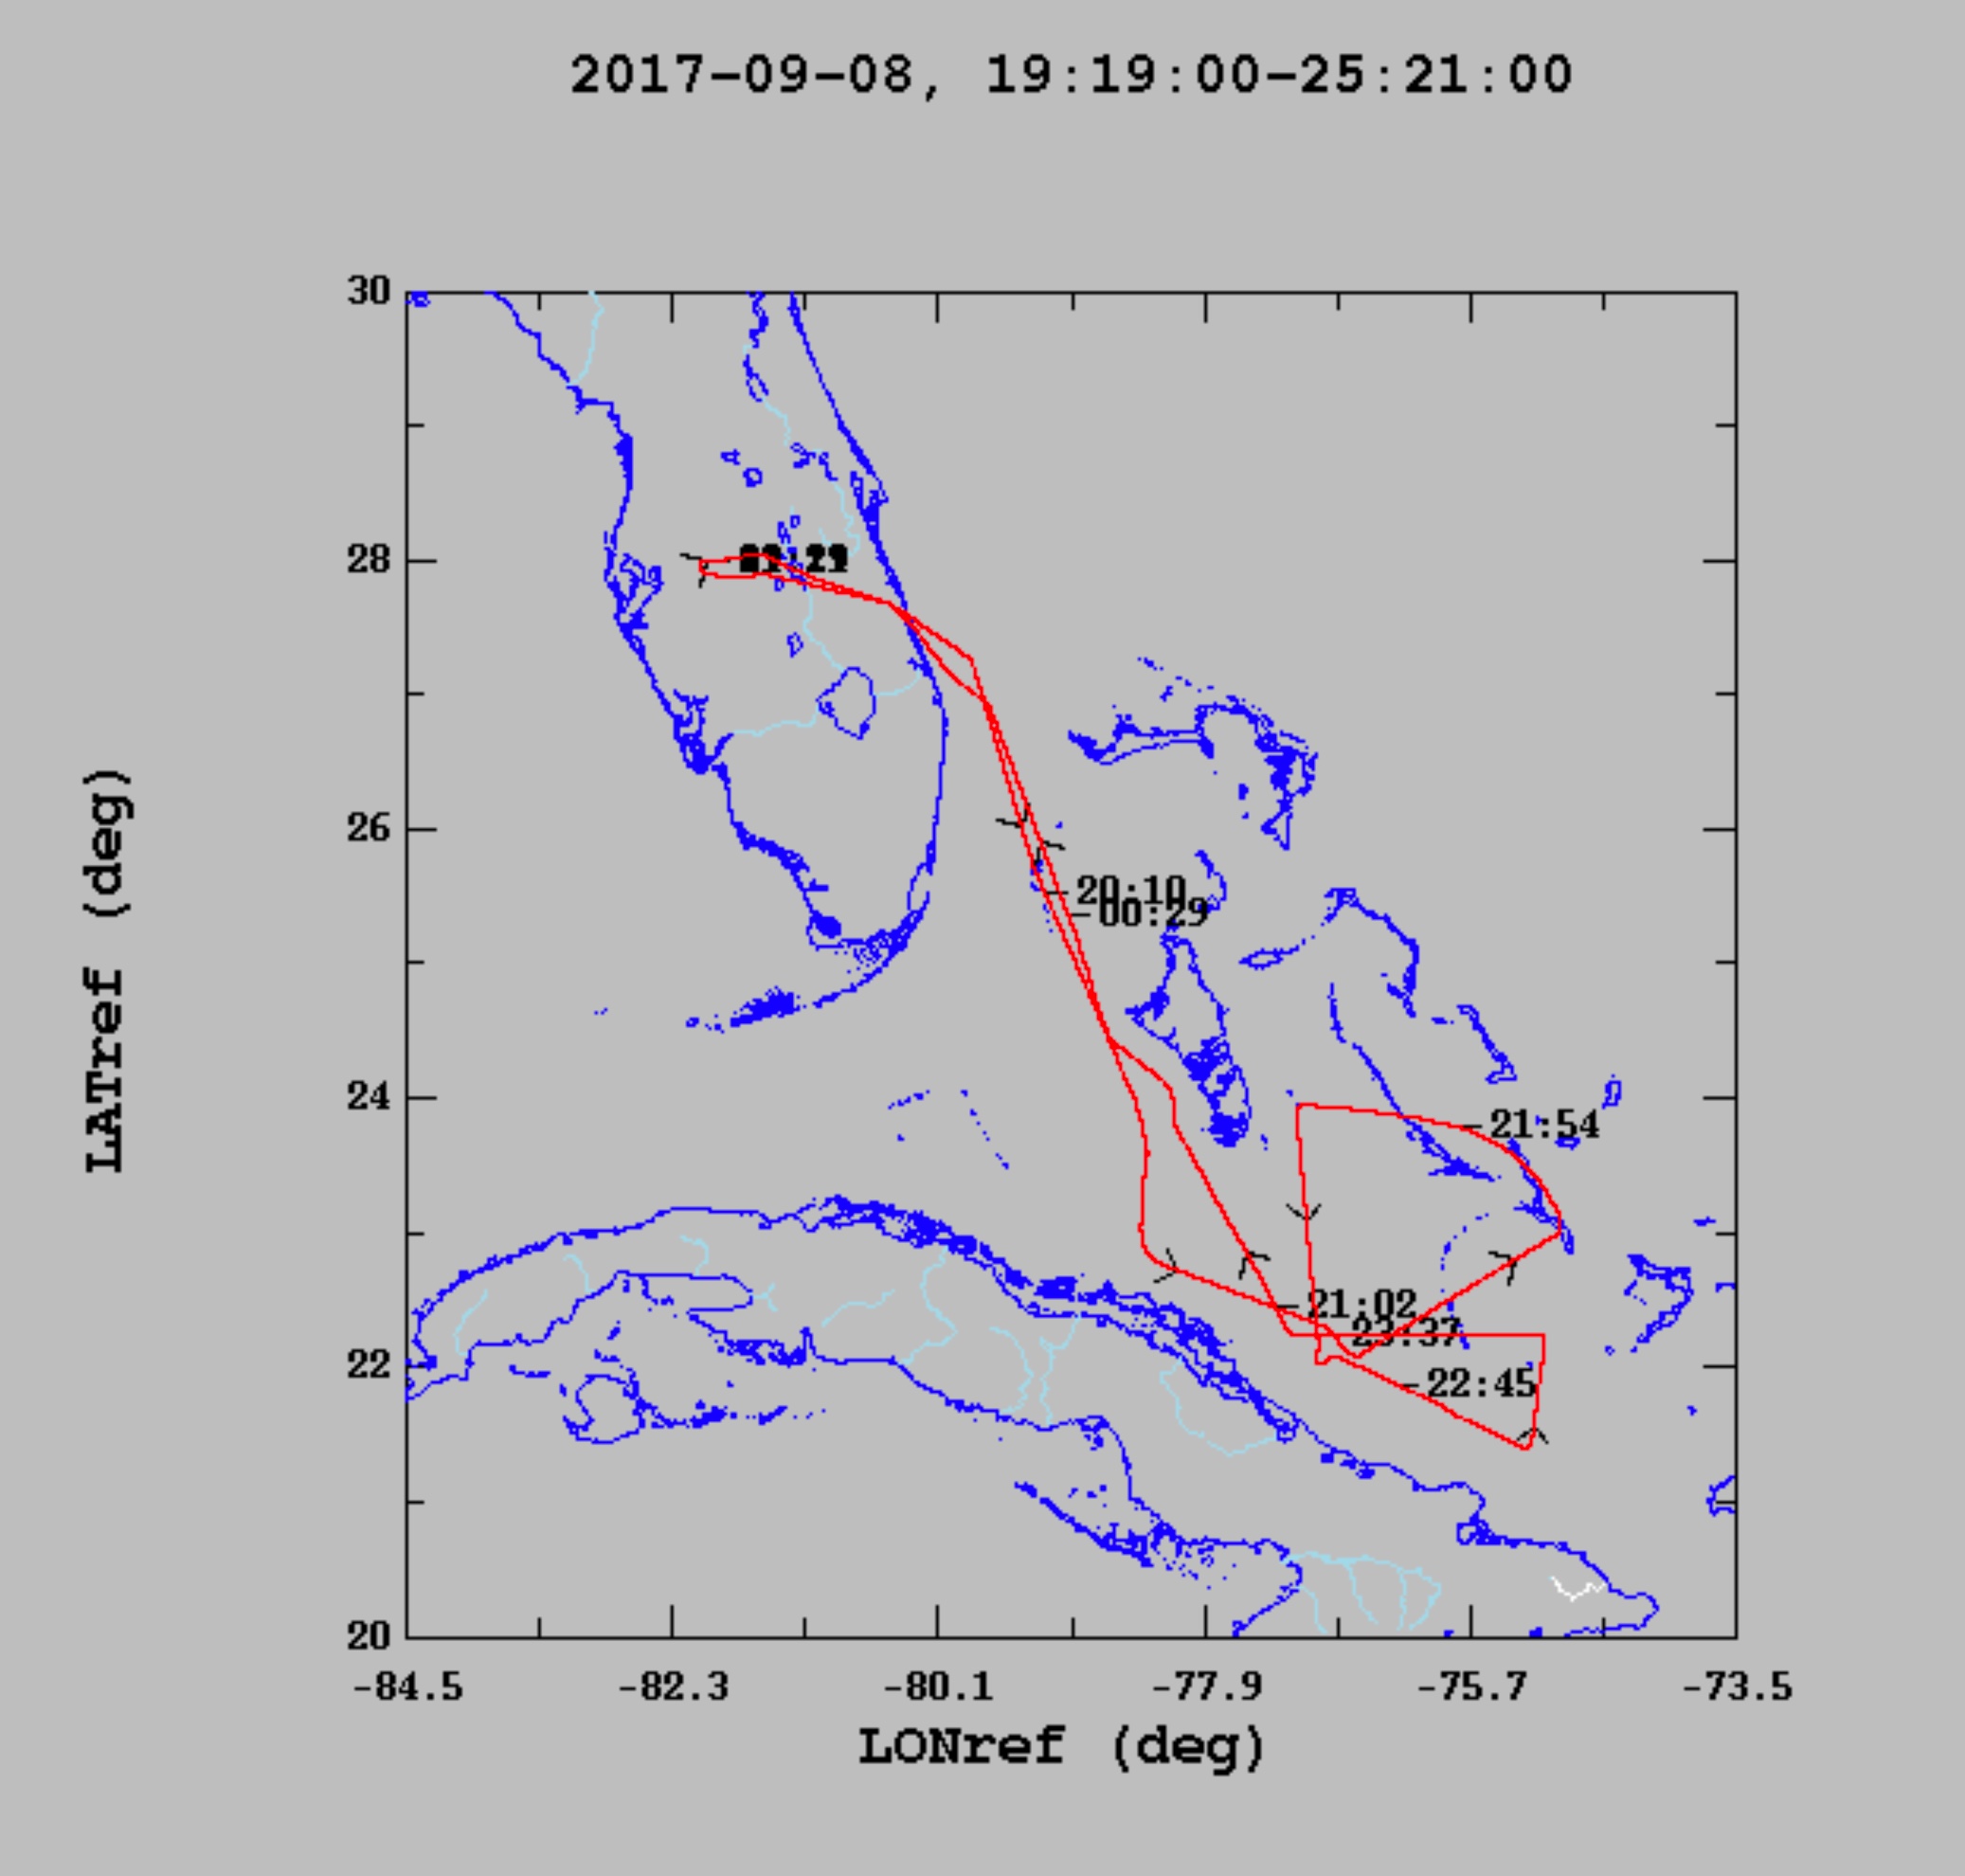
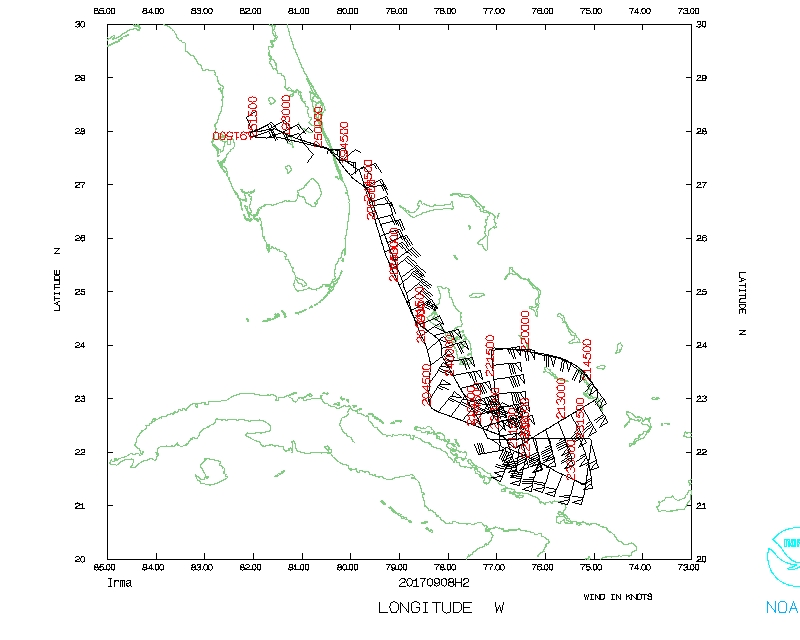
Figure 5b. Actual flight track for 20170908H2 |
Mission Summary :
| Take off | Landing
| Linder-Lakeland, FL
| 19:19 UTC
| Linder-Lakeland, FL
| 01:19 UTC
| | ||
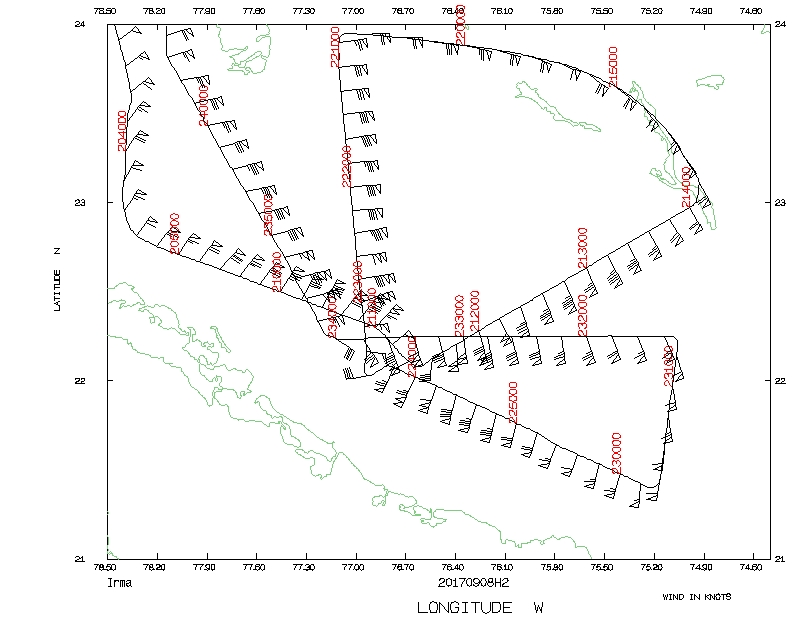
The flight pattern was reduced to conserve flight time and account for the close proximity of the center to Cuban airspace (Figure 5b). The reduction of flight time was needed to allow for the P-3 to provide center fixes to NHC the following afternoon at an earlier take off time. Three passes were completed through the center, however the last pass through the storm could not fix the center because it had moved into Cuba airspace. Tail Doppler radar analyses show the northwest quadrant of the eyewall contained the highest winds as indicated by the peak SFMR winds (Figure 7). An animation of the IR satellite imagery shows a symmetrization of eyewall convection as indicated by the cold cloud tops (Figure 6). This reformation of the eyewall structure could indicate the strengthening of Irma as indicated by some of the intensity guidance. Peak flight level winds were 153 knots. SFMR reached 136 knots while the strongest surface winds from a dropsonde were found on drop 4 with 105 knots. The majority of the combo drops were released in low to no regions of rain. Drop 4 was deployed when the LF indicated a reflectivity of 40 dBZ to test .
Figure 6. Animated IR satellite loop 08/18:55 - 09/01:25 Z |
Problems :
A total of 11 IR sondes/AXBT combos were dropped, 1 regular sonde was deployed in the center (NHC) and 3 radar analyses were completed and transmitted.
Mission Evaluation:
This TDR mission was successfully and captured 3 analyses of Hurricane Irma as it approached the north coast of Cuba. Proximity to restricted air space caused difficulty fixing the center in the final pass. A reoriented leg was attempted to provide SFMR validation data for a CYGNSS pass, however the data was displaced by 2 hours.
Approximately 6 AXBTs failed or erratically transmitted data, 1 of which was lost at an unknown time during flight. But the AVAPS technicians did not consistently communicate the failure of an AXBT or the SST of the AXBT. It was unclear which SST should be reported in the dropsonde WMO message.

|
| Figure 7. Wind analyses from 20:46 to 24:05 at (a) 0.5 km (b) 3.0 km |
Lisa Bucci
October 3, 2017
| NetCDF SFMR data | |

Timeseries wind, rain rate, and pressure plots |
|

Flight level wind plots full flight |

Flight level wind plots in storm |

SFMR wind plots full flight |

SFMR wind plots in storm |
 Flight track |
 Temperature and Moisture |
 Wind and Atlitude |
 Detailed Flight track |
Flight Director's manifest
Flight Director's log |
NetCDF data |
SFMR data |
serial data |
1 second data