Figure 1. Proposed flight track for mission 20170825H2 |
| Aircraft Commander | Justin Kibbey |
| Co-pilot | Danny Rees |
| Co-pilot | Nate Kahn |
| Flight Engineer | Ken Heystek |
| Flight Engineer | Richard Souza |
| Navigator | Pete Freeman |
| Flight Director | Mike Holmes |
| System Engineer | Mac McAlister |
| Data Technician | Dana Naeher |
| Dropsonde Operator | Jorge Delgado |
| LPS | Jon Zawislak | HRD |
| Radar | Leon Nguyen | HRD |
| Dropsonde | Brad Klotz | HRD |
| LPS | Paul Chang | NESDIS |
| IWRAP | Zorana Jelenak | NESDIS |
| Guest | Chris Ruf | NESDIS |
| Observer | Jason Sippel | HRD |
| Guest | Thomas Beau Zimmer | WTSP |
| Guest | Michell Wallace | WTSP |
| Radar | Paul Reasor | HRD |
Mission Plan :
|
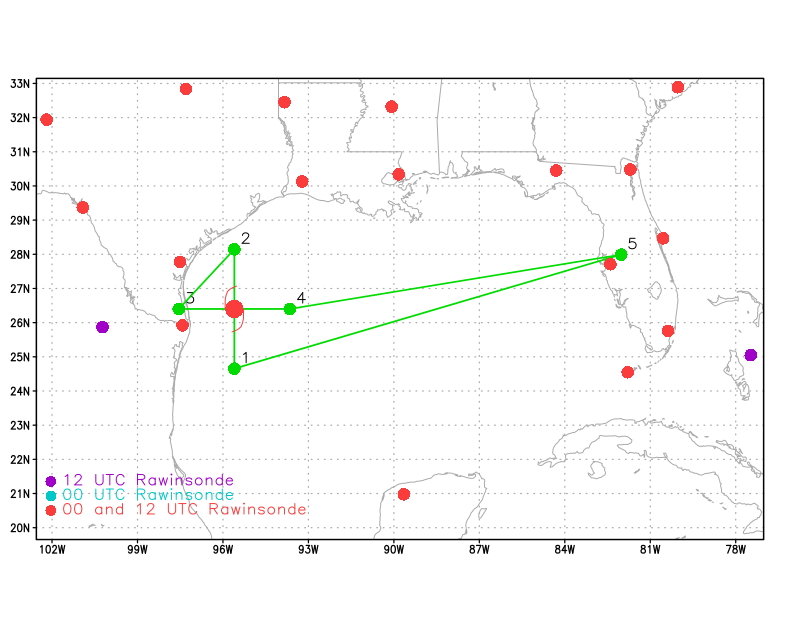
Figure 1. Proposed flight track for mission 20170825H2 |
NOAA 42 will conduct a Figure-4 pattern at 10 kft (although the altitude may be adjusted for de-confliction with Teal) with 105 nmi inbound/outbound radial legs (Fig. 1) to collect radar data for EMC. 4 dropsondes (6 total for entire pattern) / AXBT combos will be launched at each turn point in the Figure-4 pattern, as well as dropsondes only at the center (2, NHC). NHC is requesting an 1800 UTC fix. After the Figure-4 is complete, an ocean winds module (radial penetrations of high wind region) will conclude the mission; additional sondes are expected at the maximum wind. SHIPS shear, as of the 1200 UTC analysis is 228° / 8 kt. The NHC advisory at 11 am EDT / 1500 UTC: Motion, 315 / 9 kt; Intensity, 95 kt (gusts to 115 kt), 947 mb; Position, 26.7°N / 96.0°W. The most USAF recent fix is 26°35'N / 95°58'W, 949 mb, at 1414 UTC.
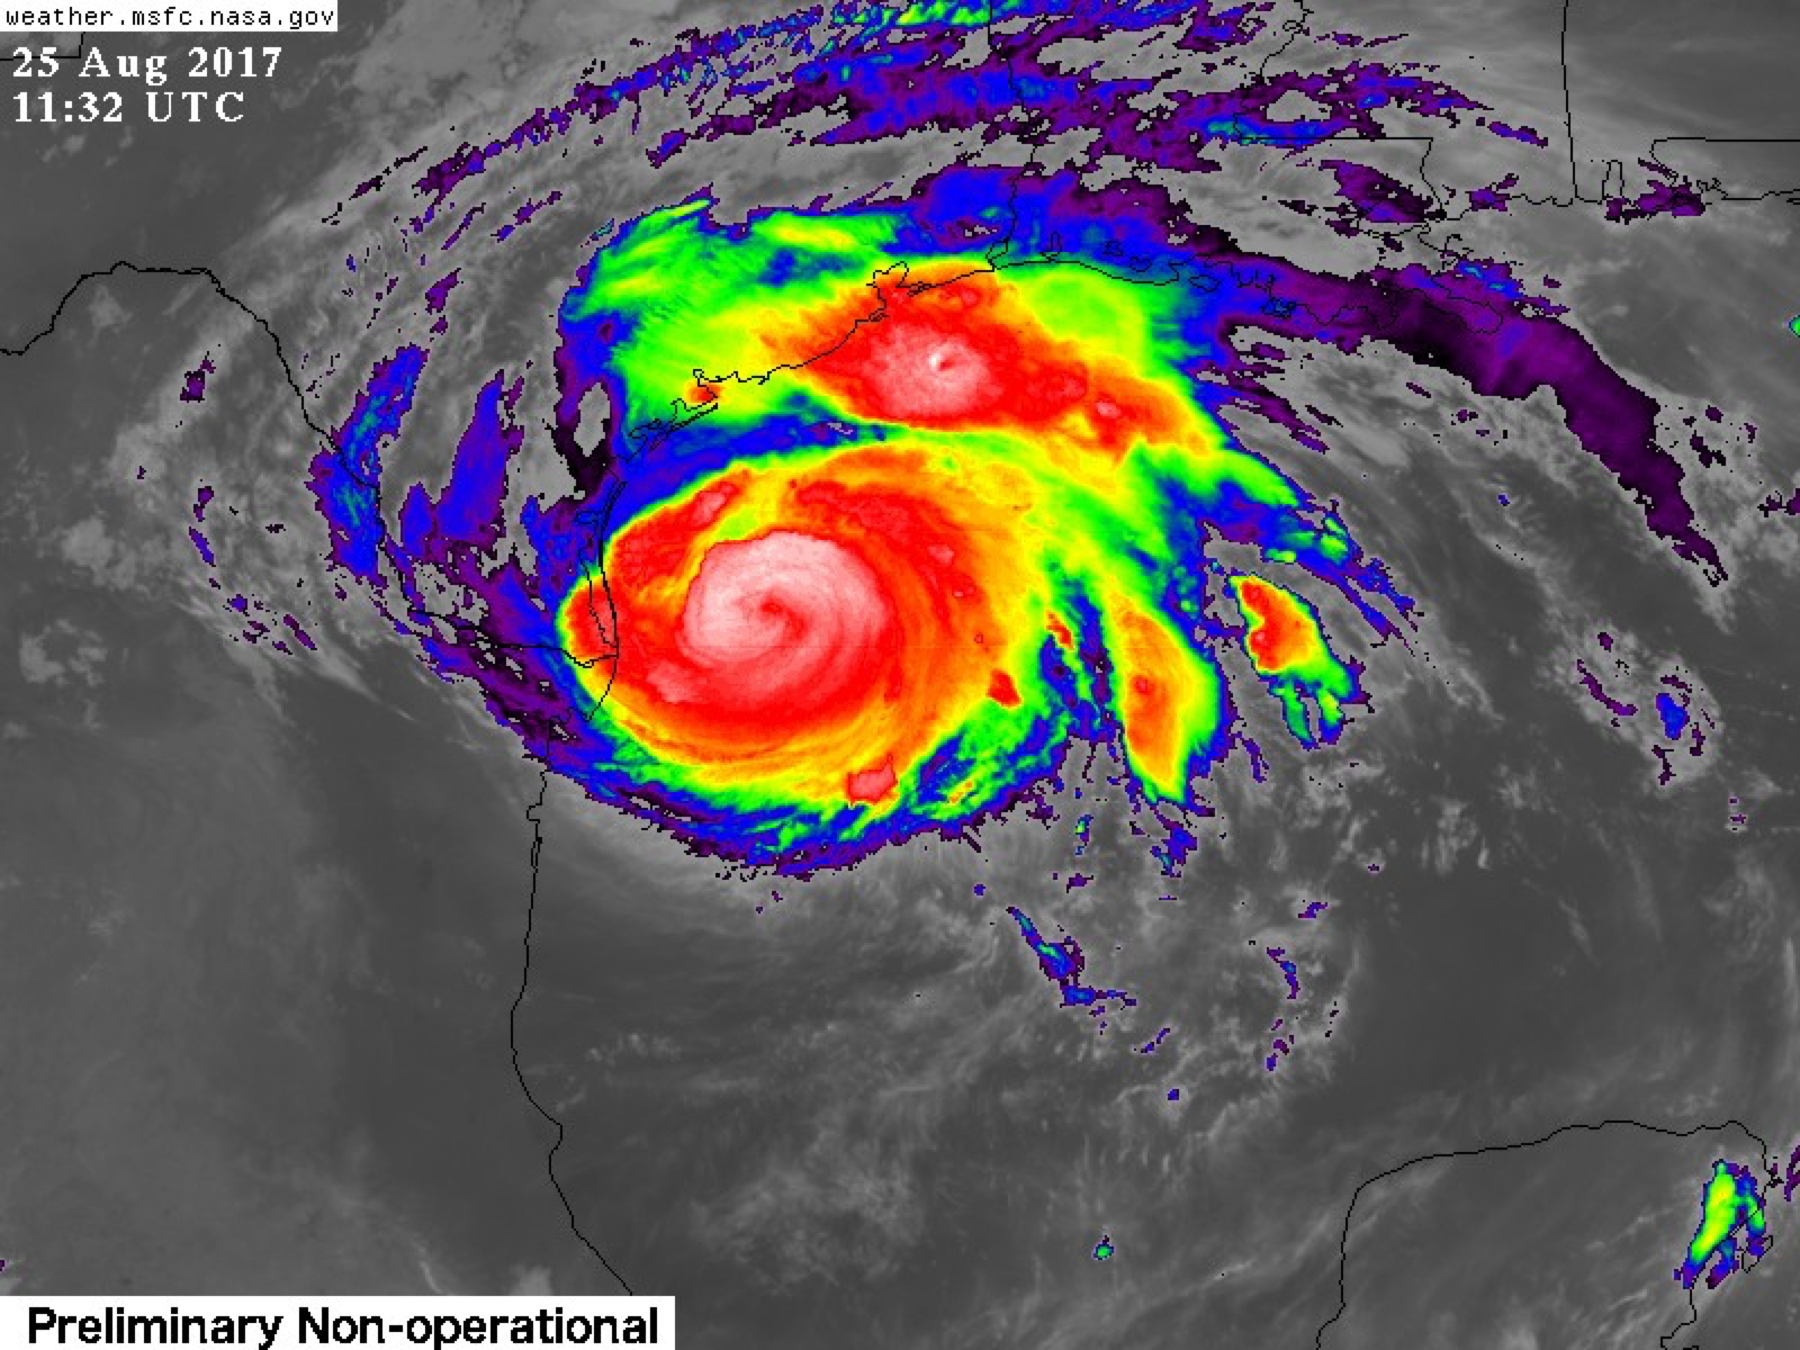
Figure 2. GOES-16 IR imagery of Harvey from 1132 UTC 25 August (image courtesy NASA MSFC, weather.msfc.nasa.gov) |
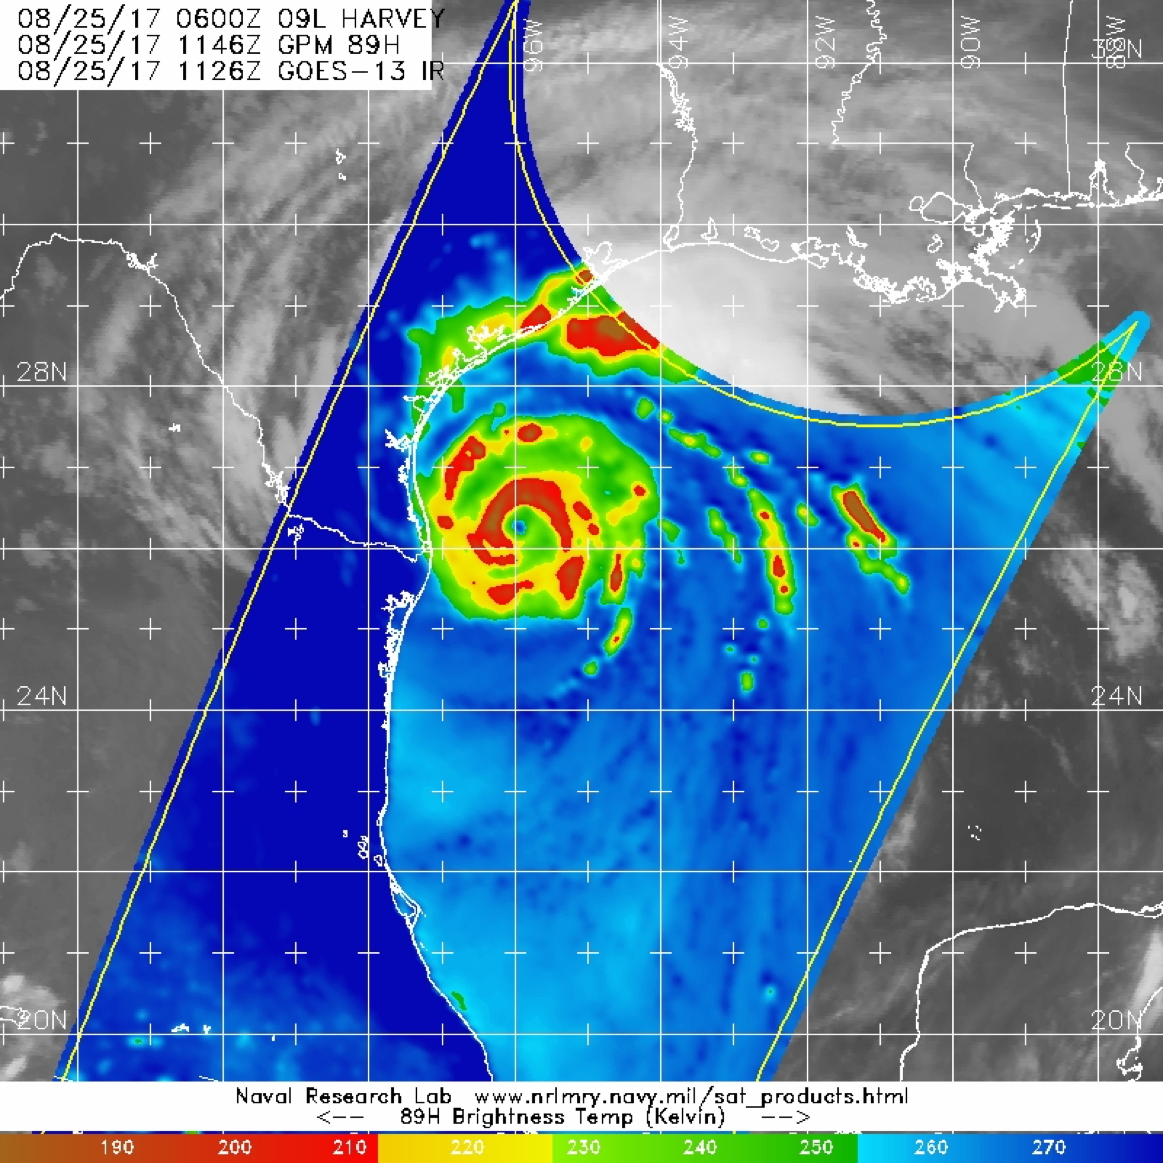
Figure 3. 89-GHz horizontally polarized brightness temperature from a GPM overpass at 1146 UTC 25 August (image courtesy the Naval Research Laboratory, nrlmry.navy.mil/TC.html) |
In the past 24 hours, Hurricane Harvey has experienced rapid intensification (1500 UTC 24 August was 55 kt, while the current intensity at 1500 UTC 25 August is 95 kt). IR imagery from GOES-16 (Fig. 2) shows an expansive central dense overcast with yet another convective burst wrapping around the eyewall from downshear right (ESE of center), around to upshear left (NW), and upshear right (SW). There are some intense convective outer bands to the north and east of the storm. Given that we will adjust the Figure-4 to enter from the north, we'll likely encounter these outer bands. Passive microwave imagery from a GPM overpass at 1146 UTC suggests a secondary eyewall has formed. Given that the intensity is currently holding steady at 95 kt, and reports of secondary eyewall formation during 170825H1, it seems plausible that Harvey is experiencing an eyewall replacement cycle. Environmental conditions remain conducive for further intensification, however, as evidenced by the continued low magnitude deep-layer vertical wind shear (Fig. 4) and high SST (>30°C). Strengthening, potentially rapid, is expected during the mission prior to landfall later in the evening (Fig. 5), as Harvey will be passing over anomalously warm SSTs close to the Texas coast. The official NHC forecast is for Harvey to reach115 kt just prior to landfall (Fig. 6).

Figure 4. IR imagery and CIMSS-derived deep-layer (850-200-hPa) vertical wind shear (contoured; contours colored by favorability for intensification, with green being "favorable", yellow being "neutral", and red being "unfavorable"), valid at 1045 UTC 25 August (images courtesy CIMSS, tropic.ssec.wisc.edu) |
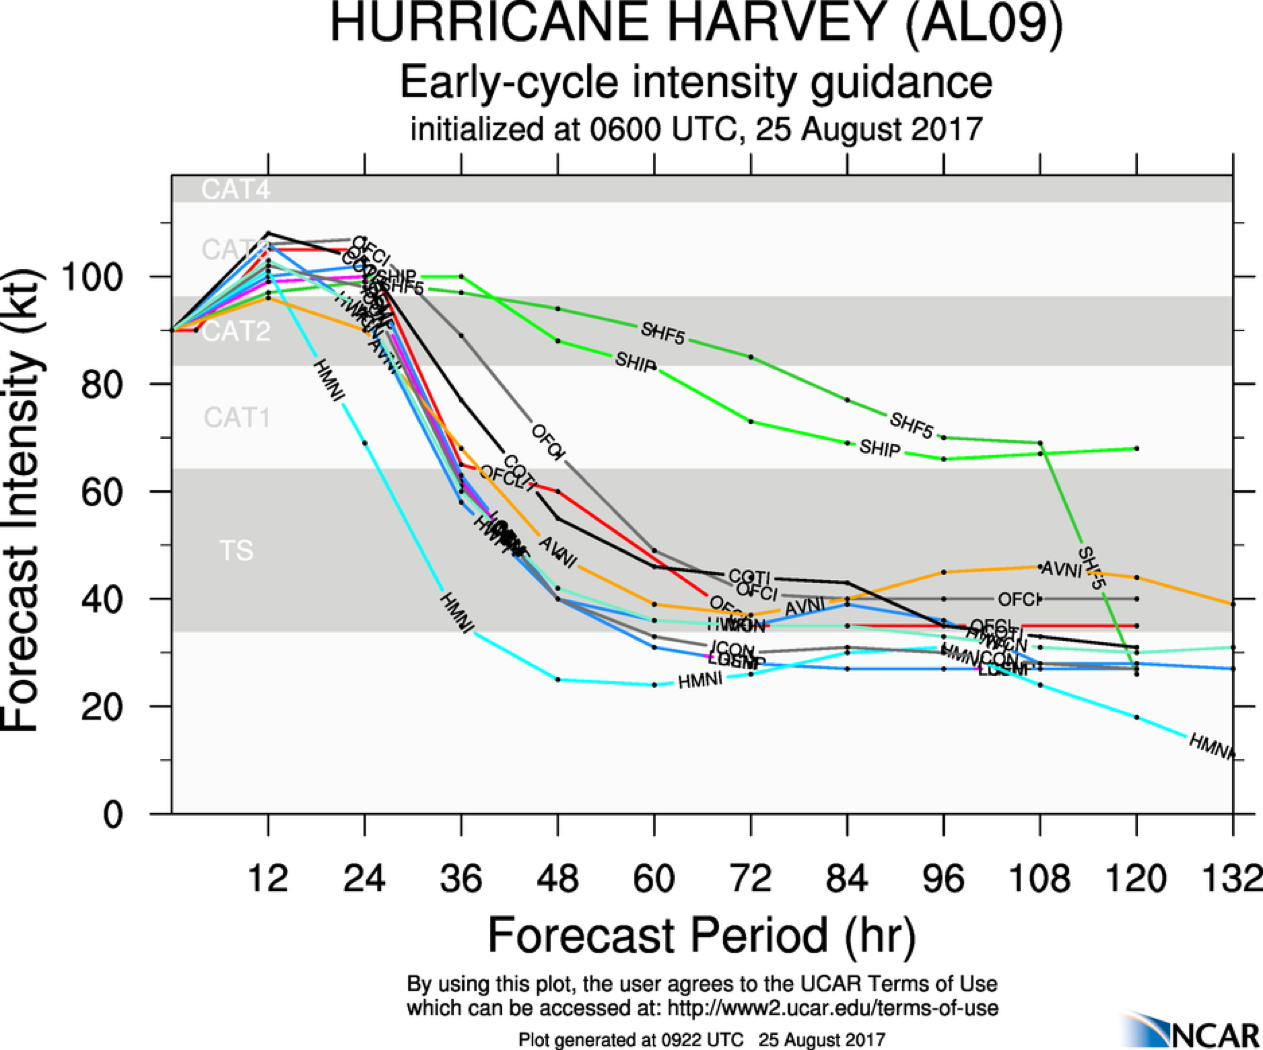
Figure 5. Intensity forecast guidance for Hurricane Harvey valid 0600 UTC 25 August (image courtesy http://www.ral.ucar.edu/guidance/realtime/current/) |
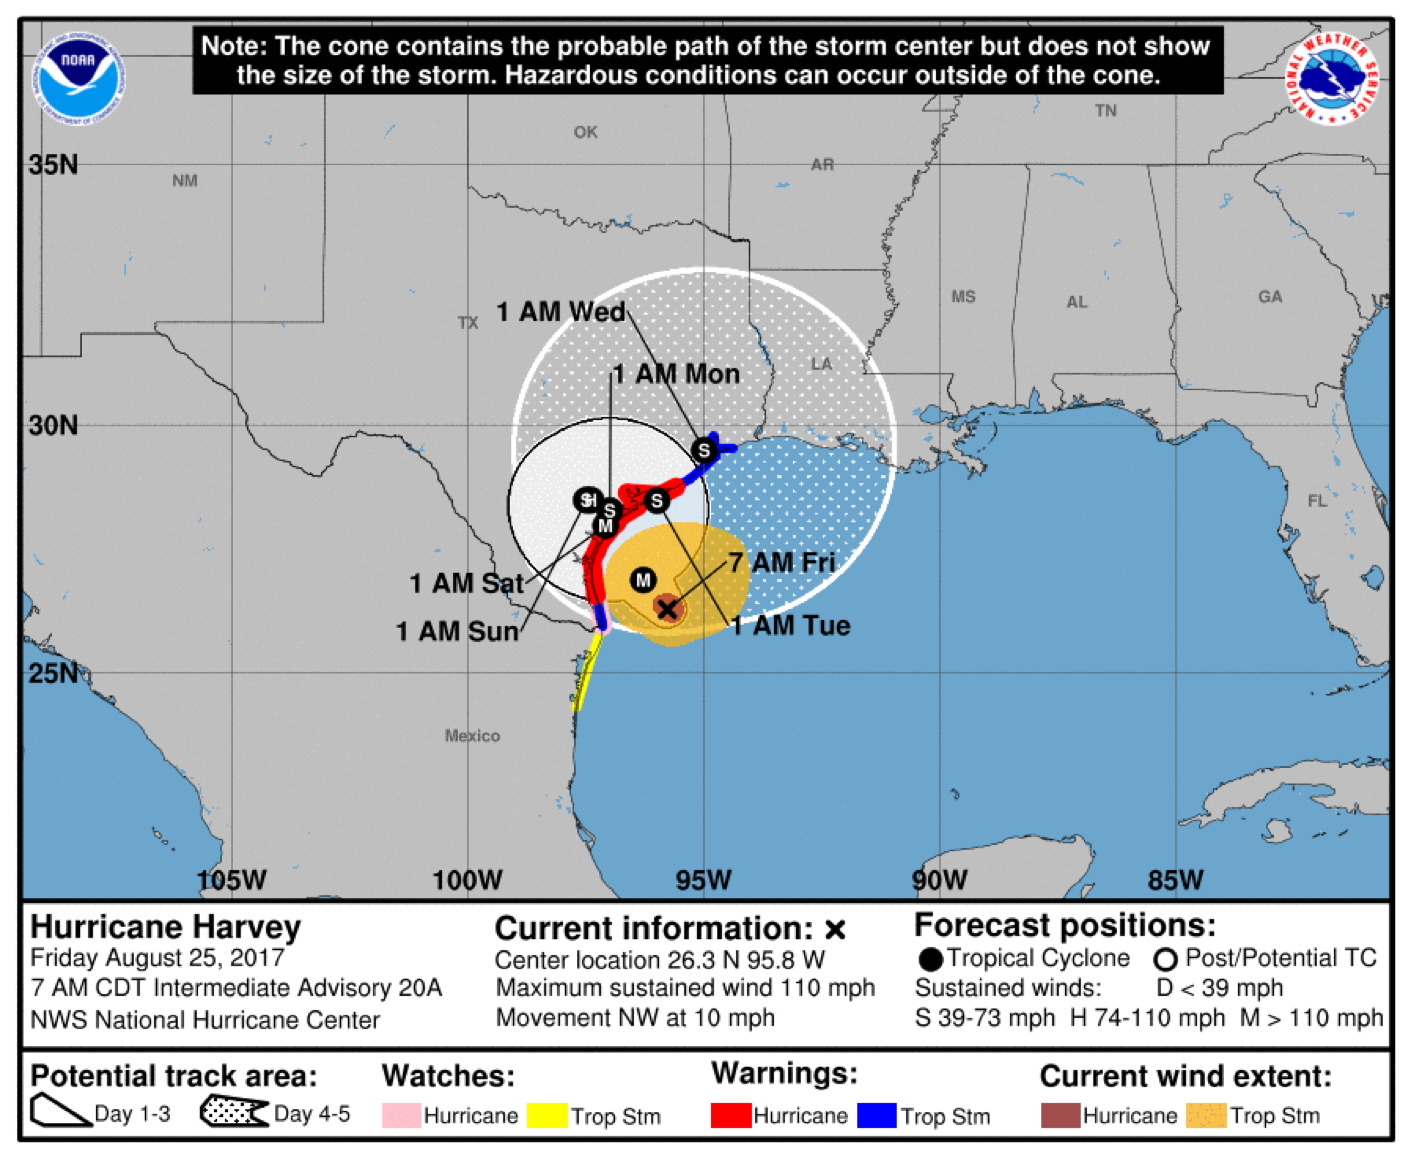
Figure 6. Official NHC forecast, valid 1200 UTC 25 August 2017 |
Mission Summary :
| Take off | Landing
| Linder-Lakeland Airport, FL
| 14:01 UTC
| Linder-Lakeland Airport, FL
| 23:17 UTC
| Penetrations
| 6
| Expendables
| 20 Dropsonde (4 HFIP, 2 NHC, 14 NESDIS), 4 AXBTs
| | ||||||
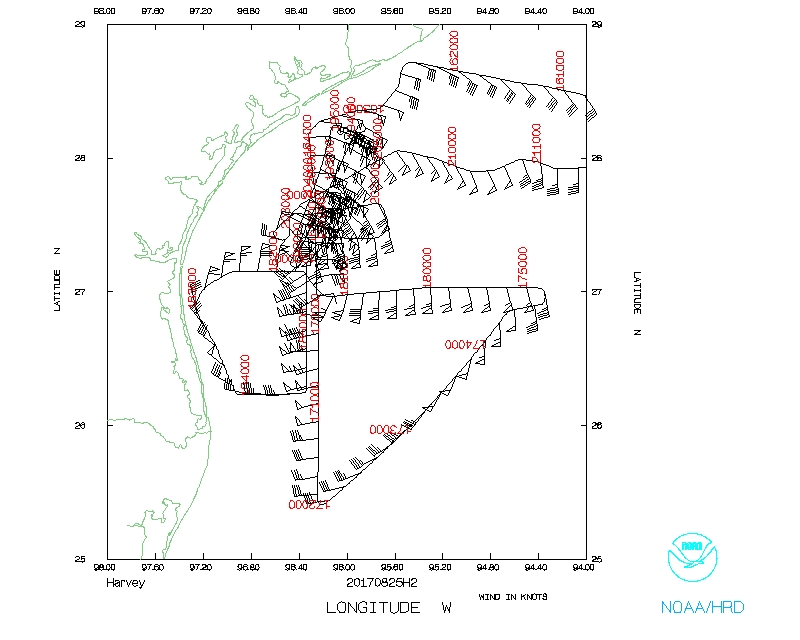
Prior to takeoff, the mission plan was updated such that the IP (original WP #2) is to the north of Harvey (Fig. 7). The primary reason was to accommodate more time in pattern given that we would take advantage of a tail wind on the ferry out. The Figure-4 was then adjusted to be inbound on 360°, outbound 180°, downwind to WP #3, inbound 090°, and outbound 270° to the endpoint. On the ferry, NHC requested a fix on both passes of the Figure-4. The Figure-4 was then followed by an ocean winds module, which consisted of multiple radial penetrations of the high winds region to the NW of the center. As in the previous flights, the aft (slave) sweeps were evaluated on the ferry to ensure that the TDR was working properly.
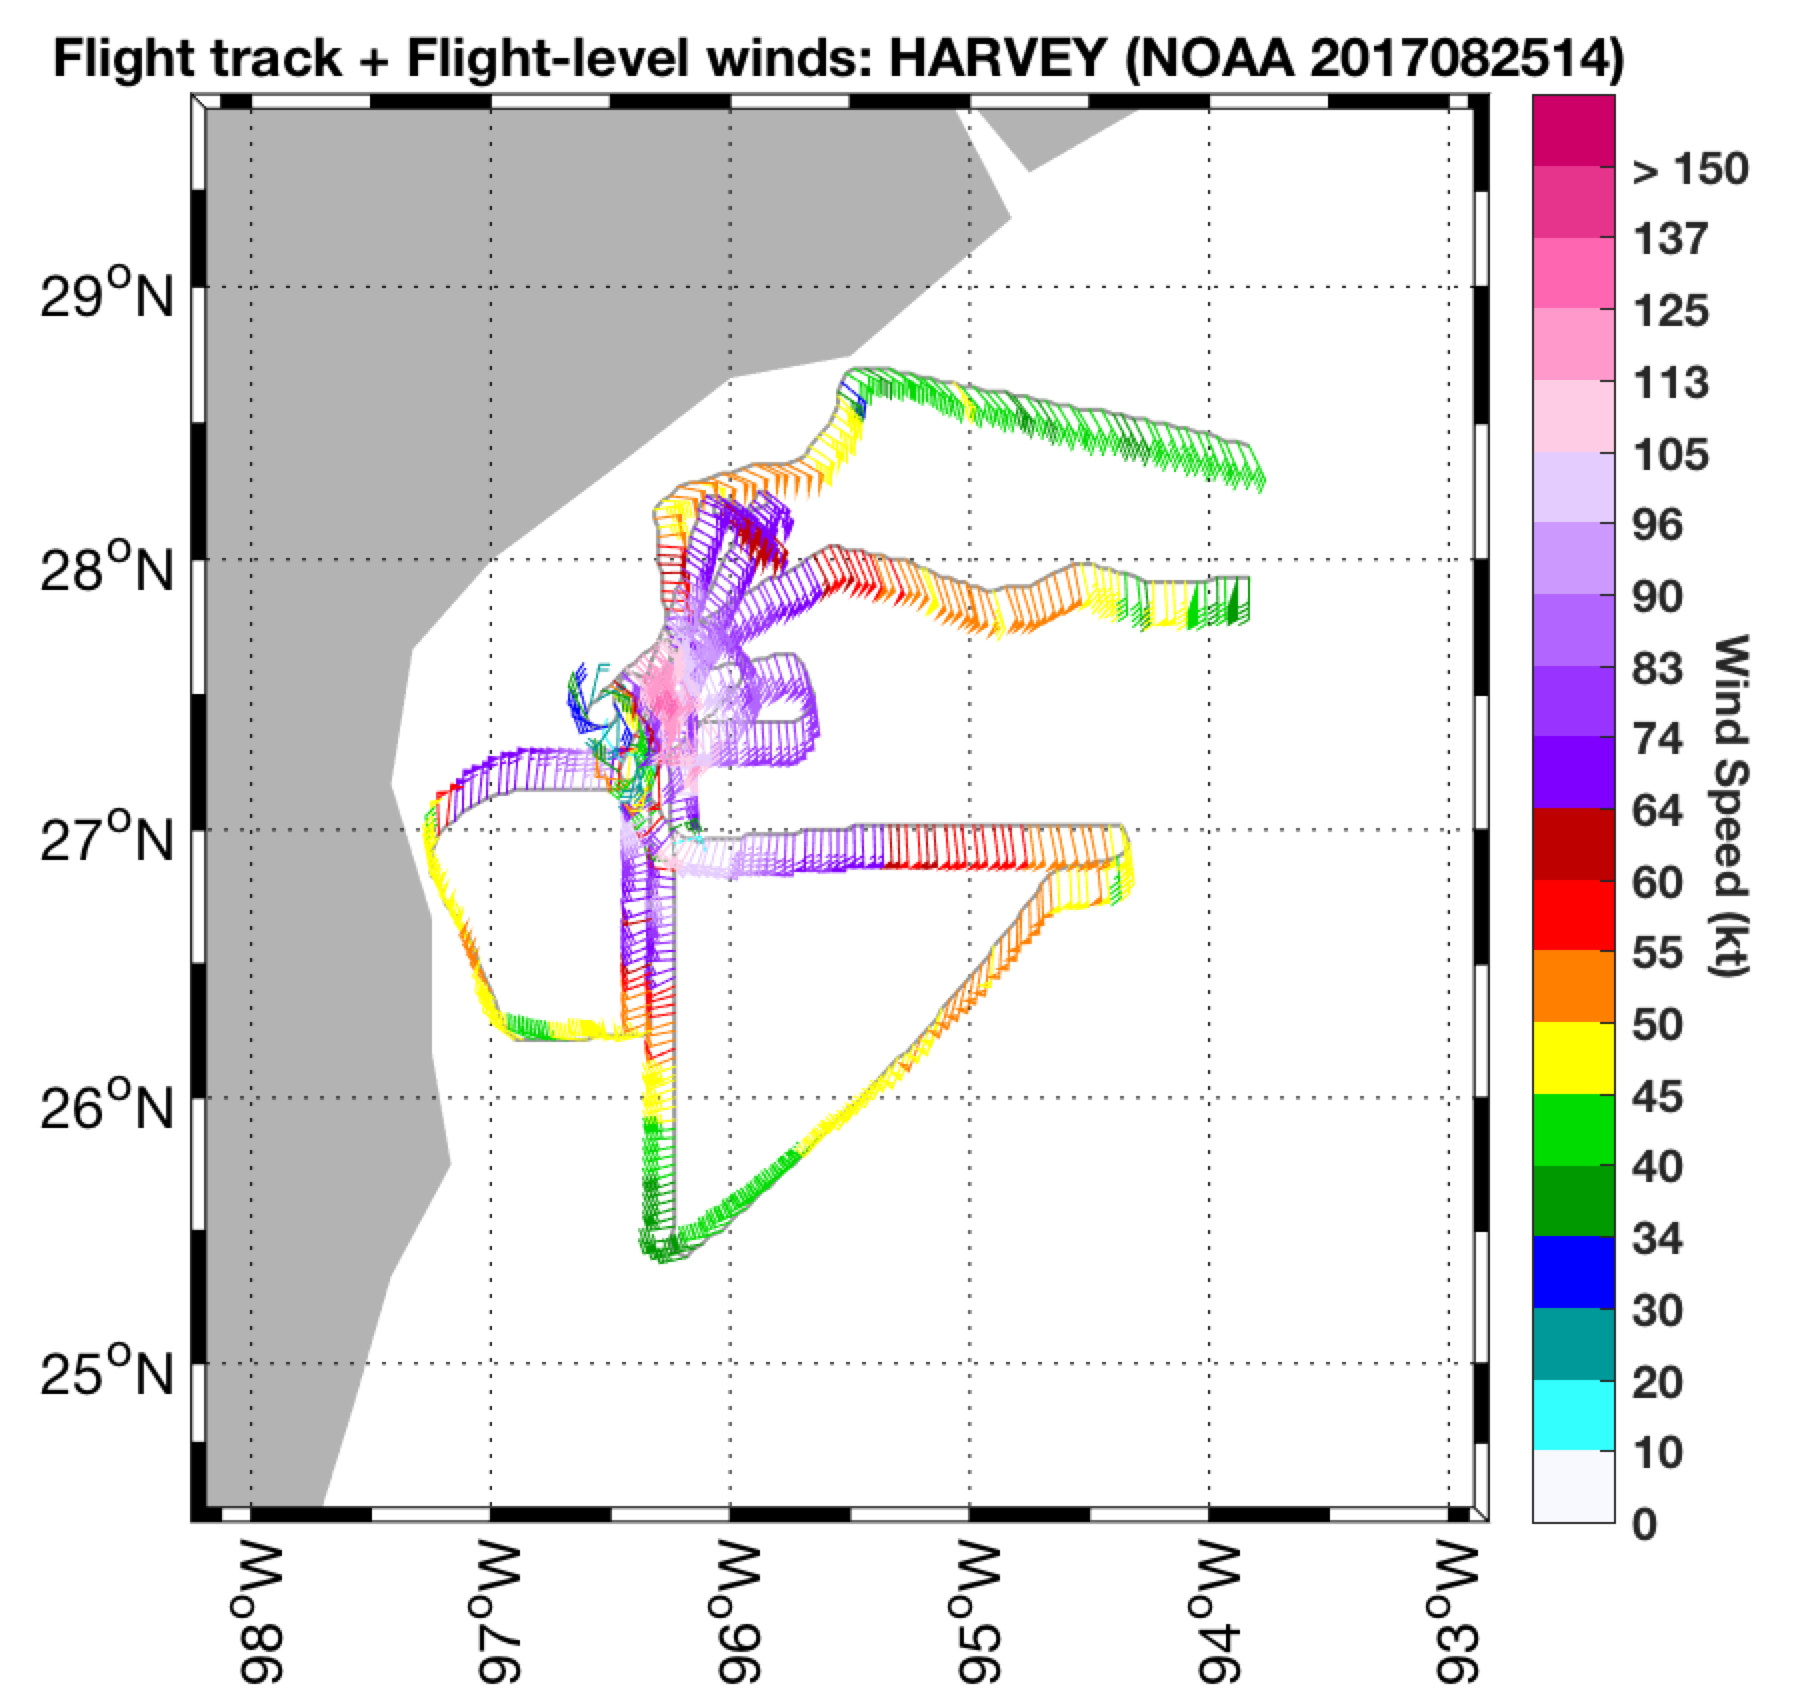
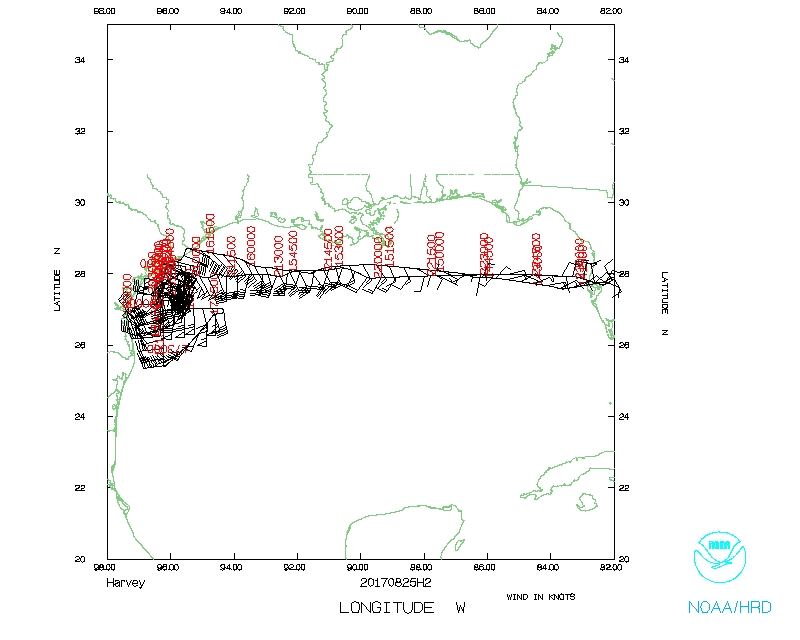
Figure 7. Actual flight track for mission 20170825H2. Flight-level winds (barbs) and wind speeds (shaded, kt) indicated. |
Because of the presence of an intense outer rainband in the vicinity of the IP, we descended early and had to navigate through the band to get on track for the inbound, which due to circumstances surrounding the weather avoidance would be reduced to about 90 nmi. We arrived at the IP at 1636 UTC near 28°16'N / 96°14'W (Sonde #1). The AXBT was not released at the IP because the water was too shallow. Instead the AXBT was dropped with the maximum wind drop on the inbound leg (at approximately 20 nmi from the center). The maximum wind drop (Sonde #2) / AXBT combo was released at 1653 UTC. The AXBT did not report data. As it was apparent that the surface winds were not decreasing, a second sonde (Sonde #3) was released a minute later. The center fix was at 1656 UTC near 26°55'N / 96°14'W (Sonde #4).
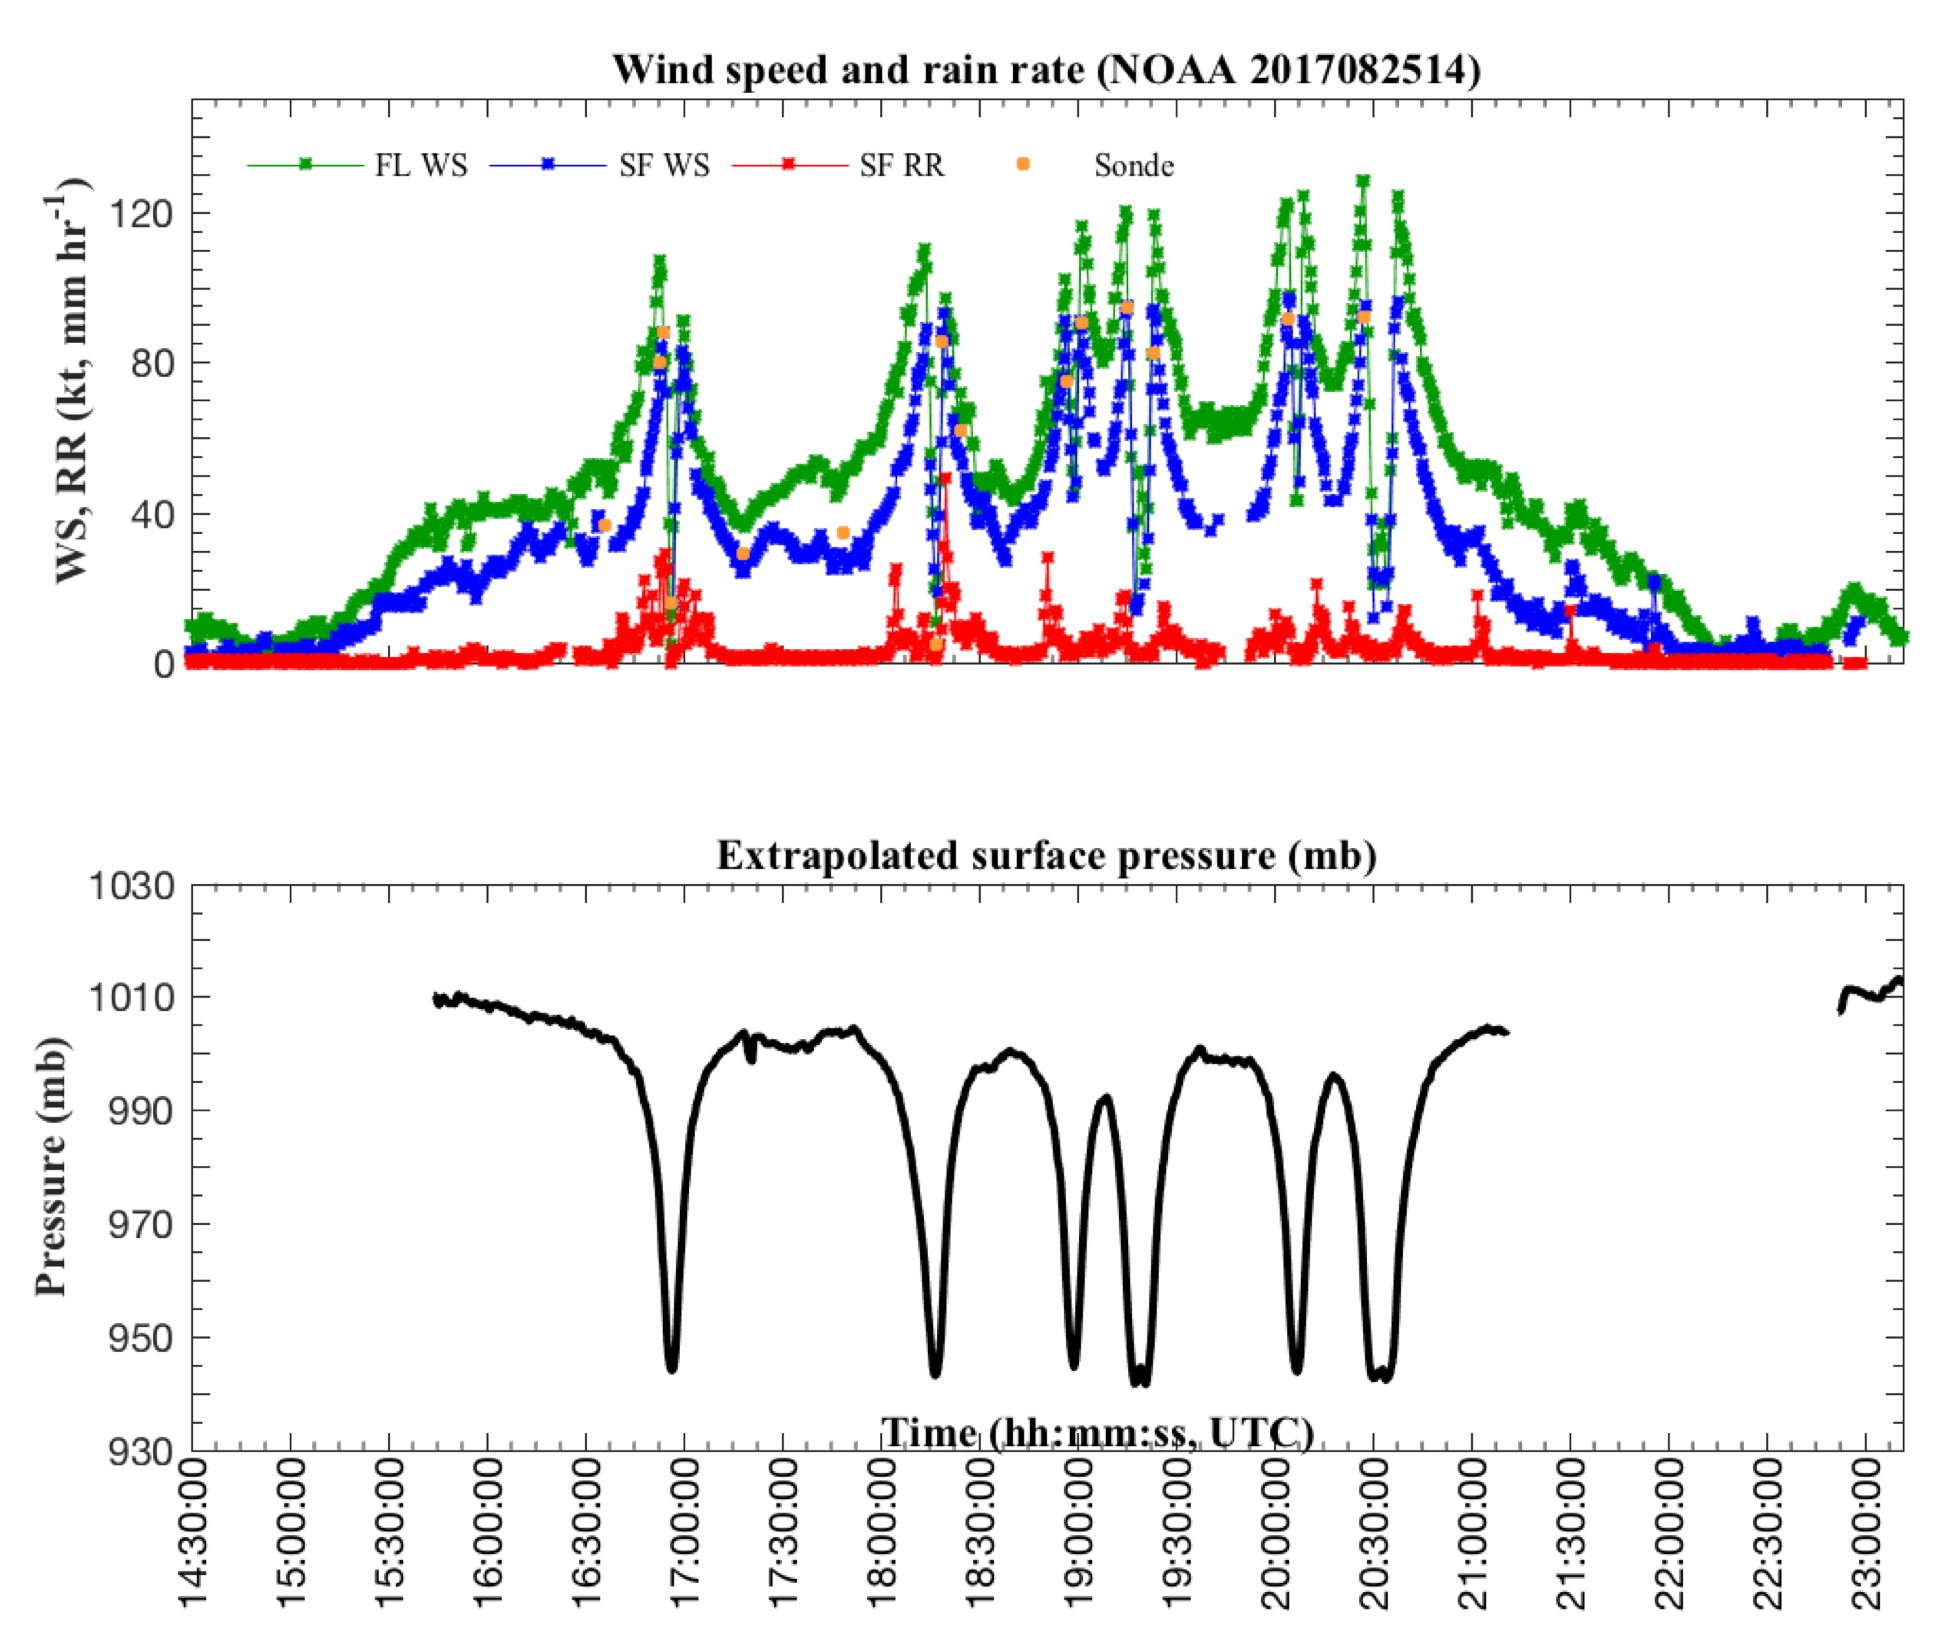
Figure 8. Time series of flight-level winds (green, kt), SFMR surface winds (blue, kt), and SFMR rain rate (red, mm/hr) for mission 20170825H2, as well as the extrapolated surface pressure (mb). |
The extrapolated pressure for this pass was 944 mb, with maximum inbound SFMR surface winds of 95 kt and flight level winds of 110 kt (Fig. 8). Sonde #3 had 102 kt surface winds, which likely contributed towards NHC's decision to raise the intensity of Harvey. Another sonde (Sonde #5) was released at the radius of maximum surface wind on the southward outbound leg. The most intense convection (according to the LF imagery, Fig. 10, and IR imagery, Fig. 9) was in the northern eyewall. The LF suggested that an inner and outer eyewall was present, which was consistent with reports from earlier Teal observations (1414 UTC) of an inner eye diameter of 12 nmi and outer eye diameter of 28 nmi.
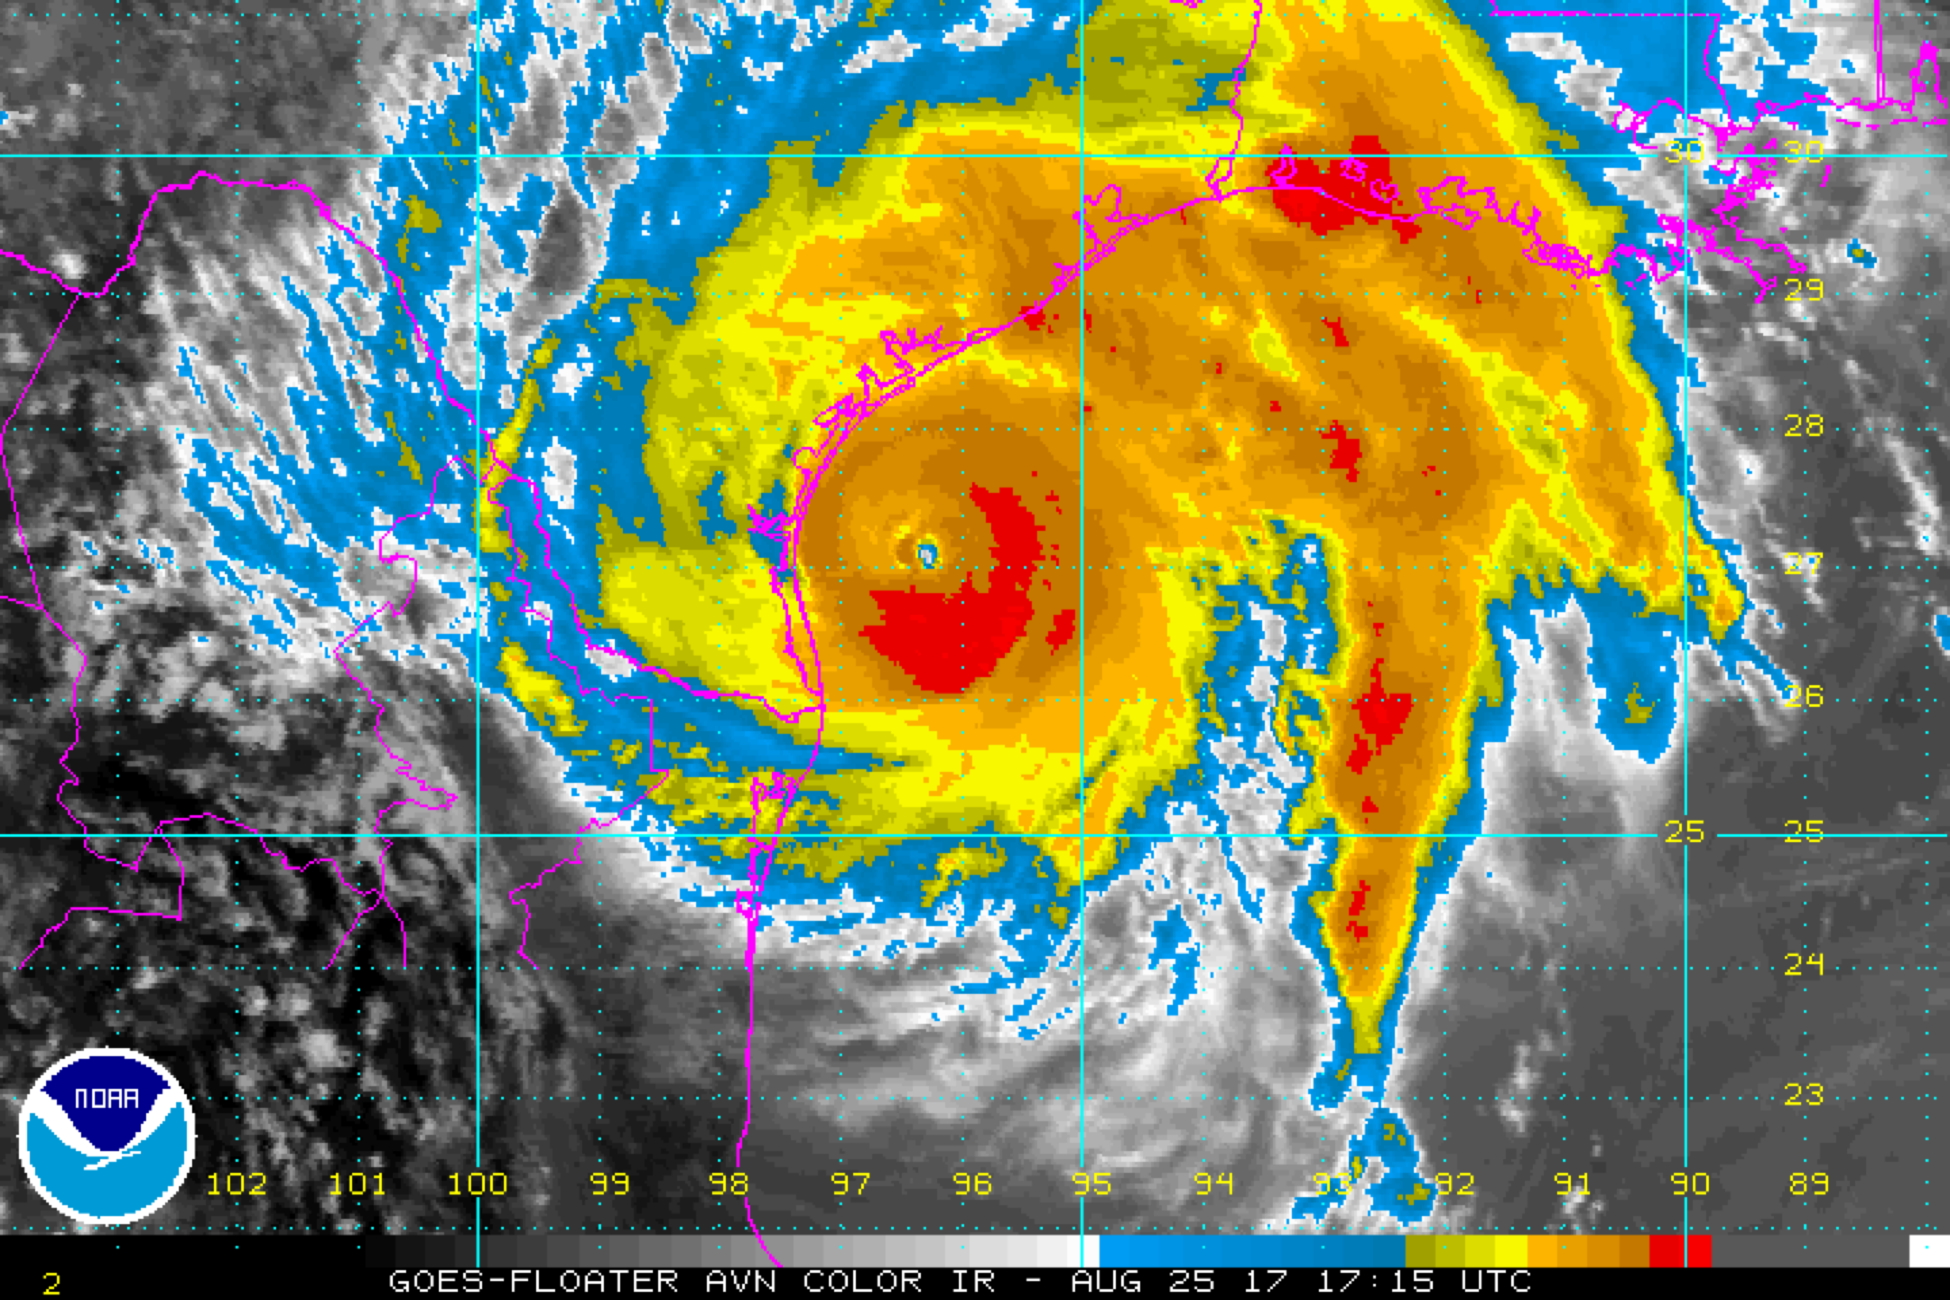
Figure 9. GOES IR imagery at 1715 UTC 25 August, 20 minutes after the first center pass |
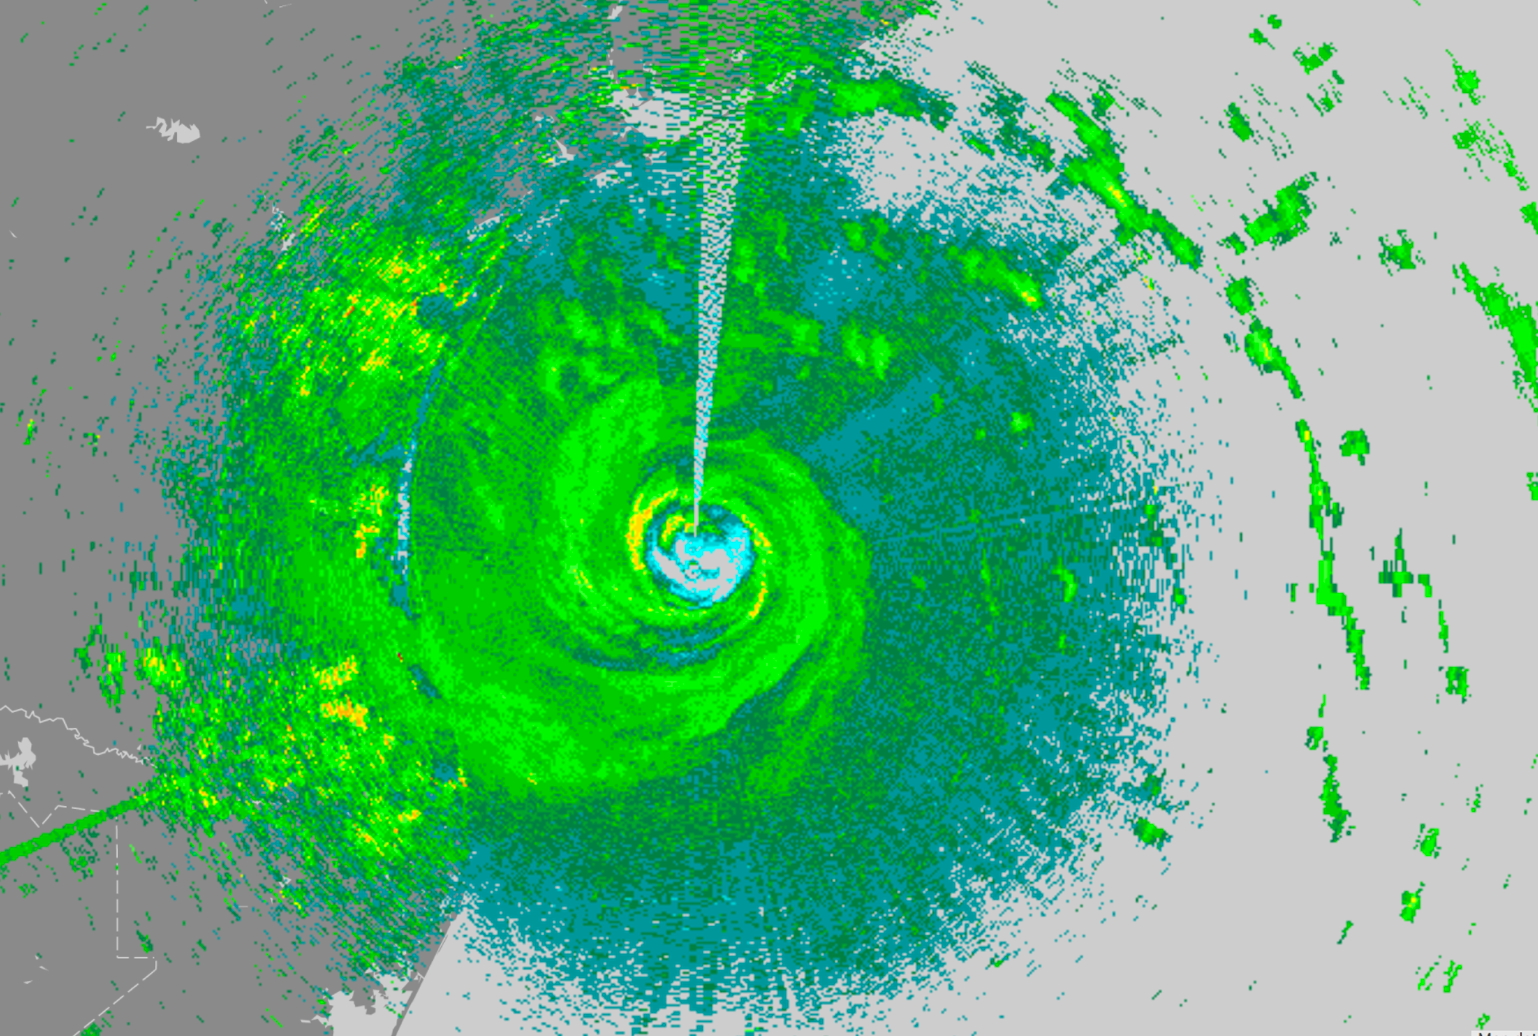
Figure 10. LF imagery at 1656 UTC 25 August |
We proceeded outbound on the 180° radial to WP #2. As there was very little precipitation beyond ~50-60 nmi south of the center, this leg was abbreviated to 70 nmi in length. We arrived at WP #2 at 1718 UTC (Sonde #6 / AXBT). The AXBT did report good data (SST, 30.1-30.2°C). Other than some anvil above and shallow congestus below, the downwind leg to WP #3 (1748 UTC, Sonde #7 / AXBT) southeast of the center was generally rain-free. The AXBT at WP #3 did not report good data. During this time there was a discussion between the Flight Director, the LPS, and Chang about the strategy for going outbound to the west of the center on the next pass, with the concern being safety in the rainband region between the center and the coastline. All were in agreement that the decision for proceeding outbound to WP #4 from the center would be made prior to entering the eye on the next pass. Also, while the first pass was completed with the LF in full sweep, it was placed in "wedge mode" for the remainder of the mission (with exception for when we were in the center).
Soon after our turn inbound on the 090° radial at WP #3, we were informed that the Teal mission would require the remainder of our mission to be flown at 8 kft (we were at 10 kft). Unfortunately this descent occurred on the inbound leg. A sonde was again released at the radius of maximum wind (Sonde #8) at 1813 UTC. We entered the eye and fixed the center at 1816 UTC near 27°9'N / 96°22'W (Sonde #9). The surface pressure from the center sonde was 944.4 mb. Given that, according to the LF, the precipitation to the west of the center (between the center and the Texas coast) was mostly stratiform (LF, Fig. 12, accompanied with IR imagery, Fig. 11), we decided to proceed outbound on 270° for 30-40 nmi. The most intense precipitation was observed in this western eyewall (Fig. 12). Another sonde (Sonde #10) was released at 1819 UTC near the maximum wind on the outbound to the west. Along with this sonde, the final AXBT was released (rather than at the endpoint, which would have located it in shallower water); however the BT did not report data. The peak SFMR surface wind was 104 kt. Upon reaching the endpoint on this abbreviated leg, we dropped a sonde (Sonde #11) and turned southward to exit the Figure-4. Despite apparently being in stratiform rain the turbulence experienced in this quadrant was the most persistent of the flight.
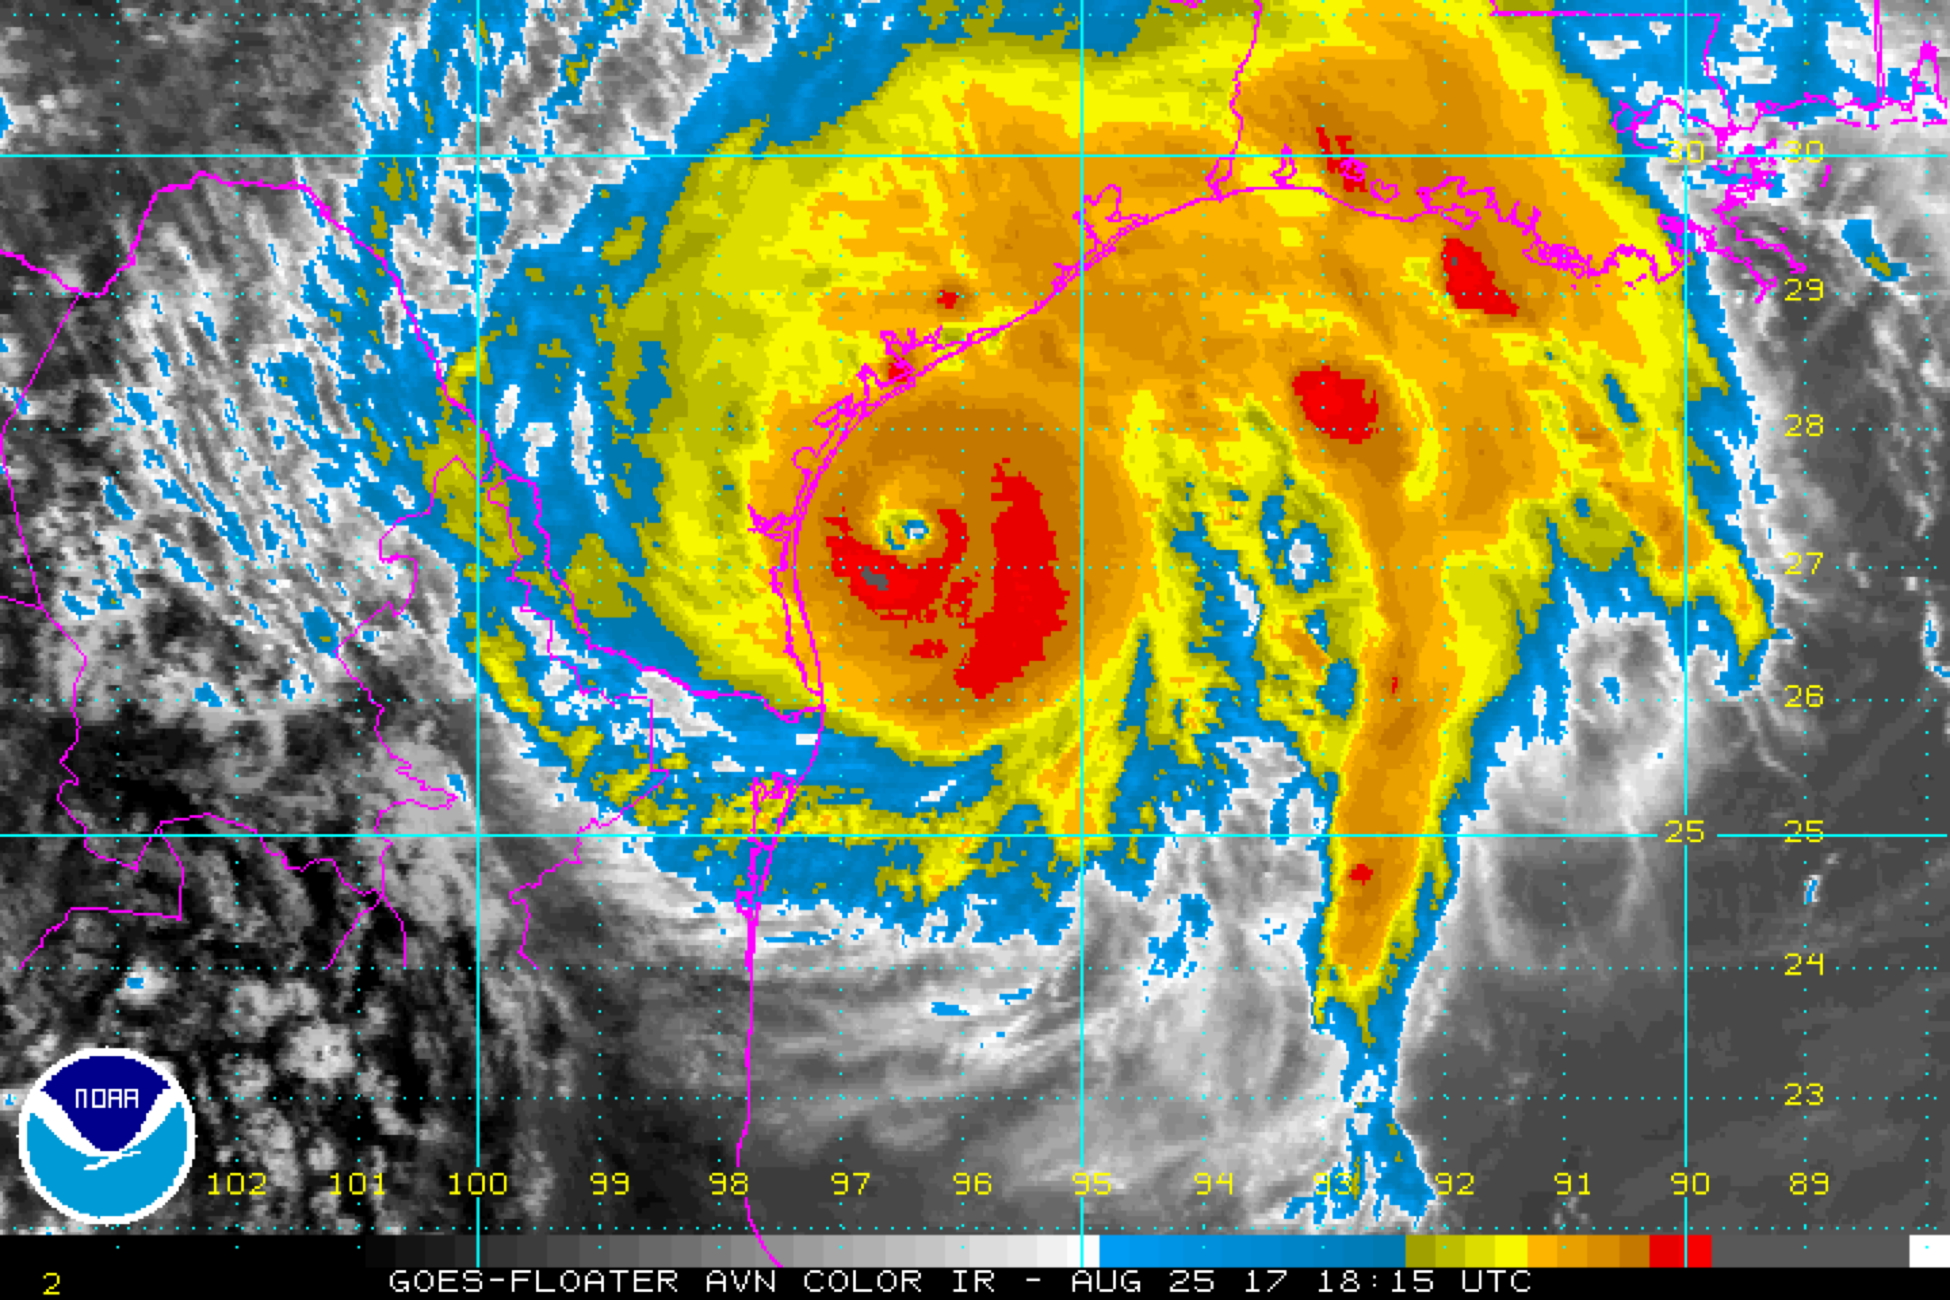
Figure 11. GOES IR imagery at 1815 UTC 25 August |
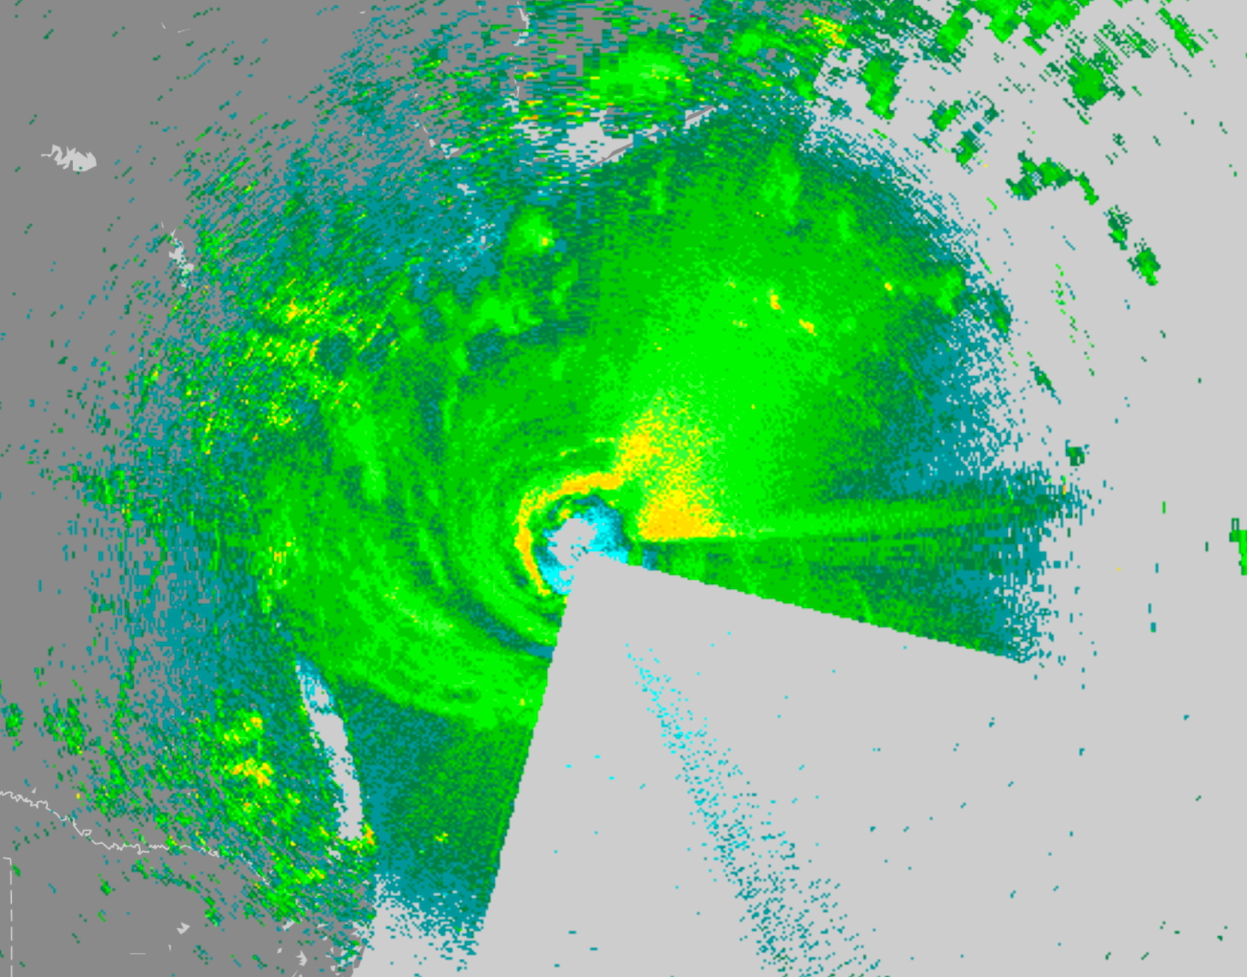
Figure 12. LF imagery at 1816 UTC 25 August |
Having completed the Figure-4, we moved into the ocean winds portion of the mission, which was to sample the high winds to the north/northeast of the center. We traversed downwind and entered inbound along 180° to the center, with an IP beginning around 1845 UTC near 26°17'N / 96°20'W. A sonde was dropped at the maximum wind inbound from the south (Sonde #12). We reached the center at 1858 UTC, however we did not drop a sonde, nor fix the center. For the remainder of the mission, we passed through the high wind region along radials between 030° and 060° seven times. Legs were approximately 25-30 nmi in length, with the exception of two. As we were going to loiter at the end of the third leg, the LPS requested to extend the leg outbound another 10-15 nmi to get more radial coverage. Loitering was convenient as ASPEN had crashed, and needed to be recovered so that dropsonde QC processing could continue. The second exception was the final outbound from the center (045° to start, though rotated to 060° for avoidance from Teal). The LPS requested to remain straight/level for 60-70 nmi initially, and later requested an extension of ~15 nmi further to pass through an outer rainband. Maximum observed flight level winds during the module were 128 kt, with a peak SFMR of 104 kt (Fig. 8). Sondes were released at the maximum wind on each in/outbound radial.
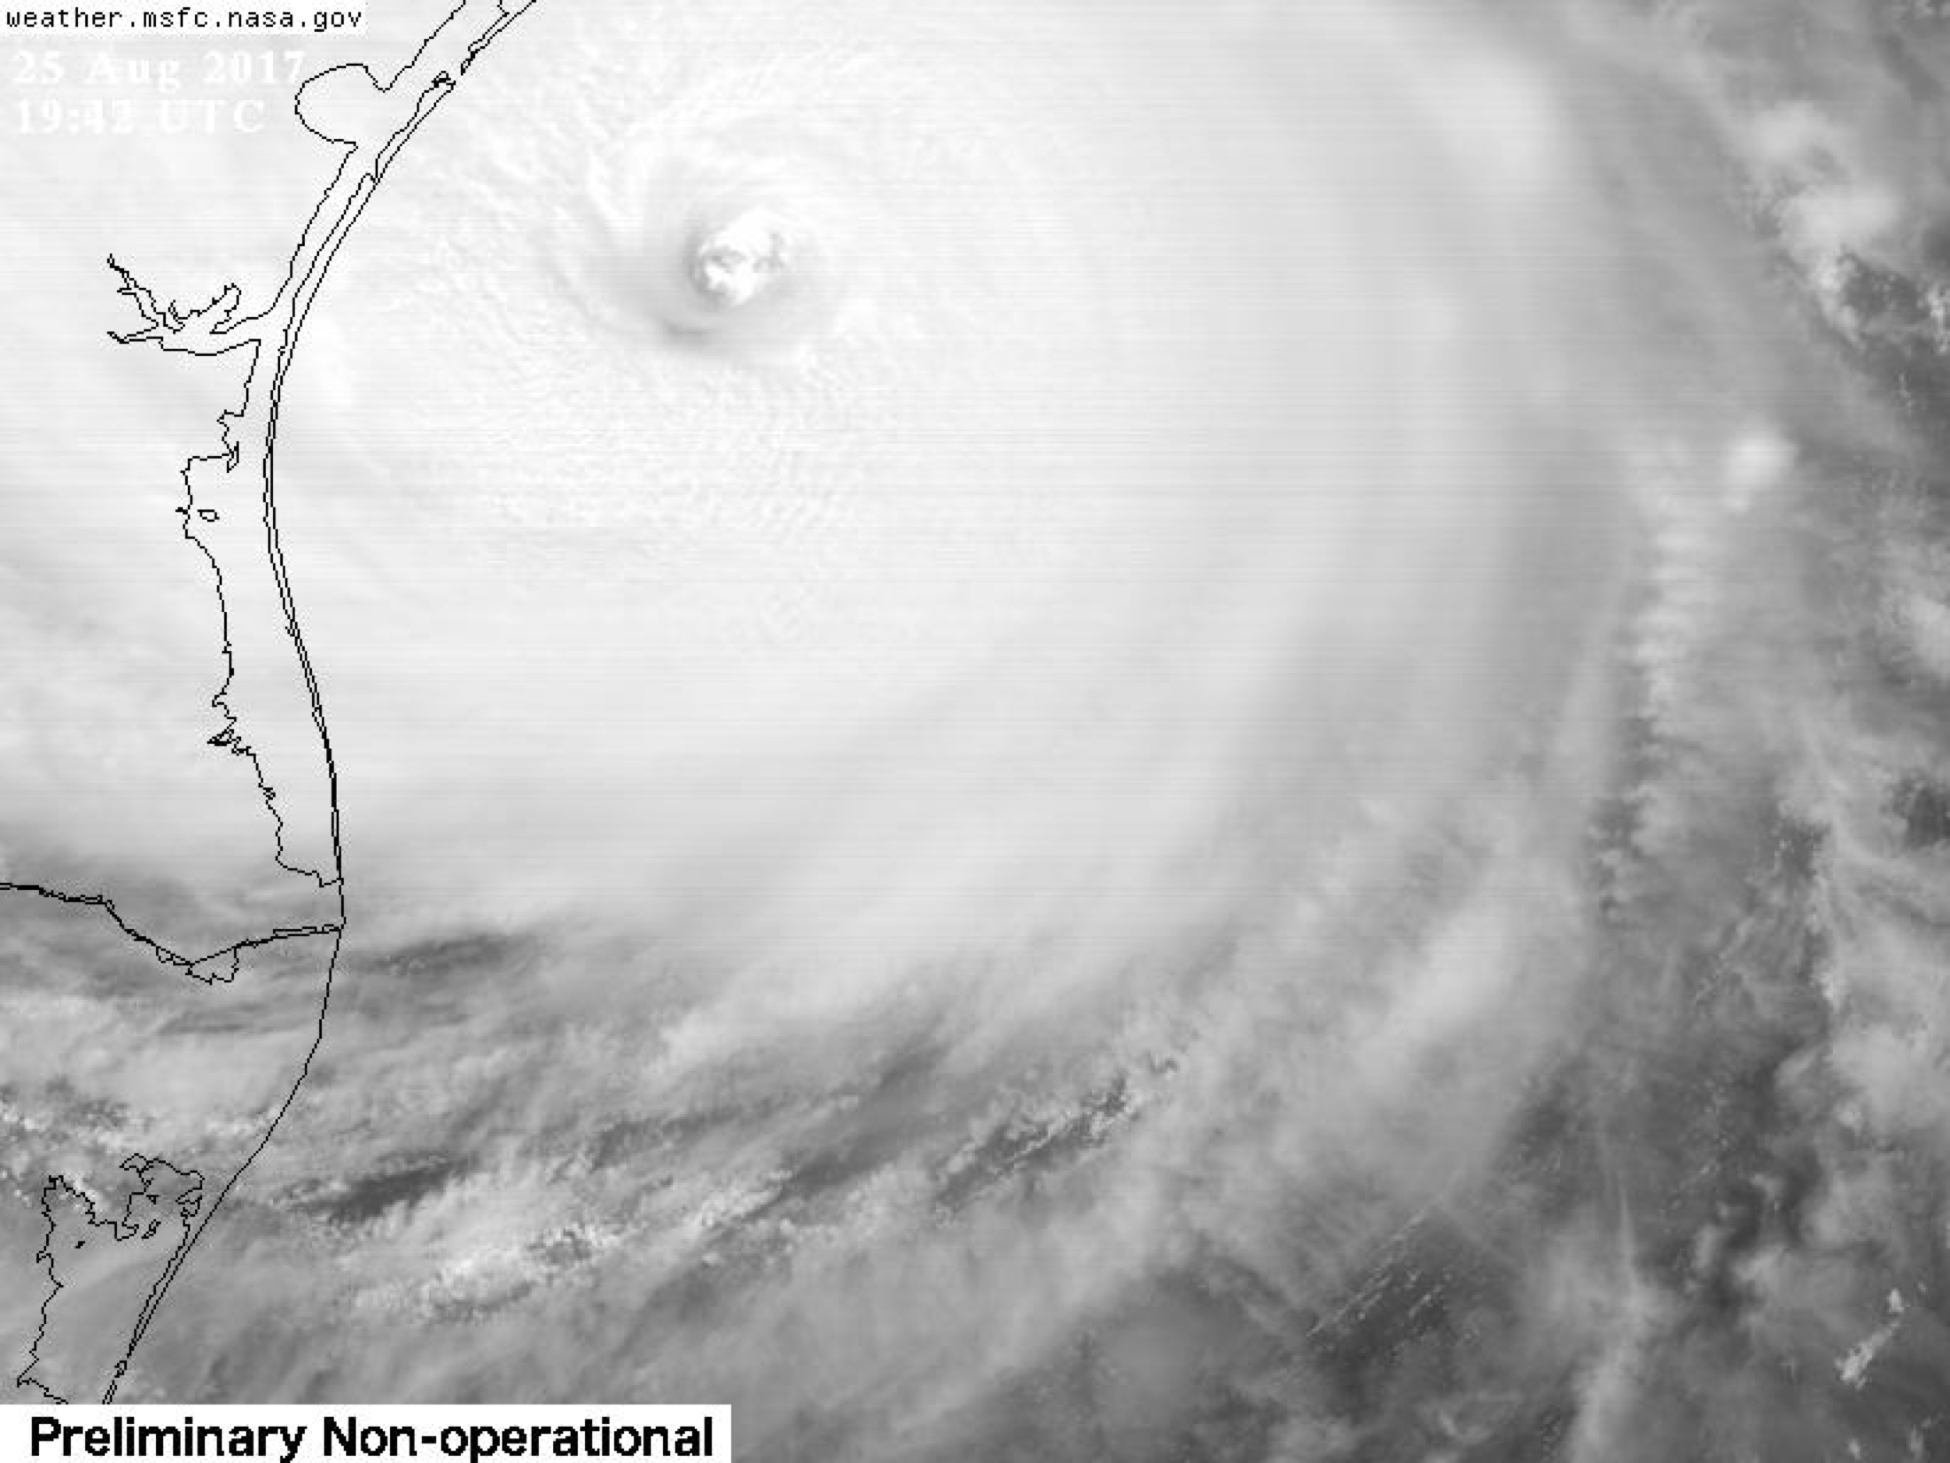
Figure 13. GOES-16 visible imagery of Harvey from 1942 UTC 25 August (image courtesy NASA MSFC, weather.msfc.nasa.gov) |
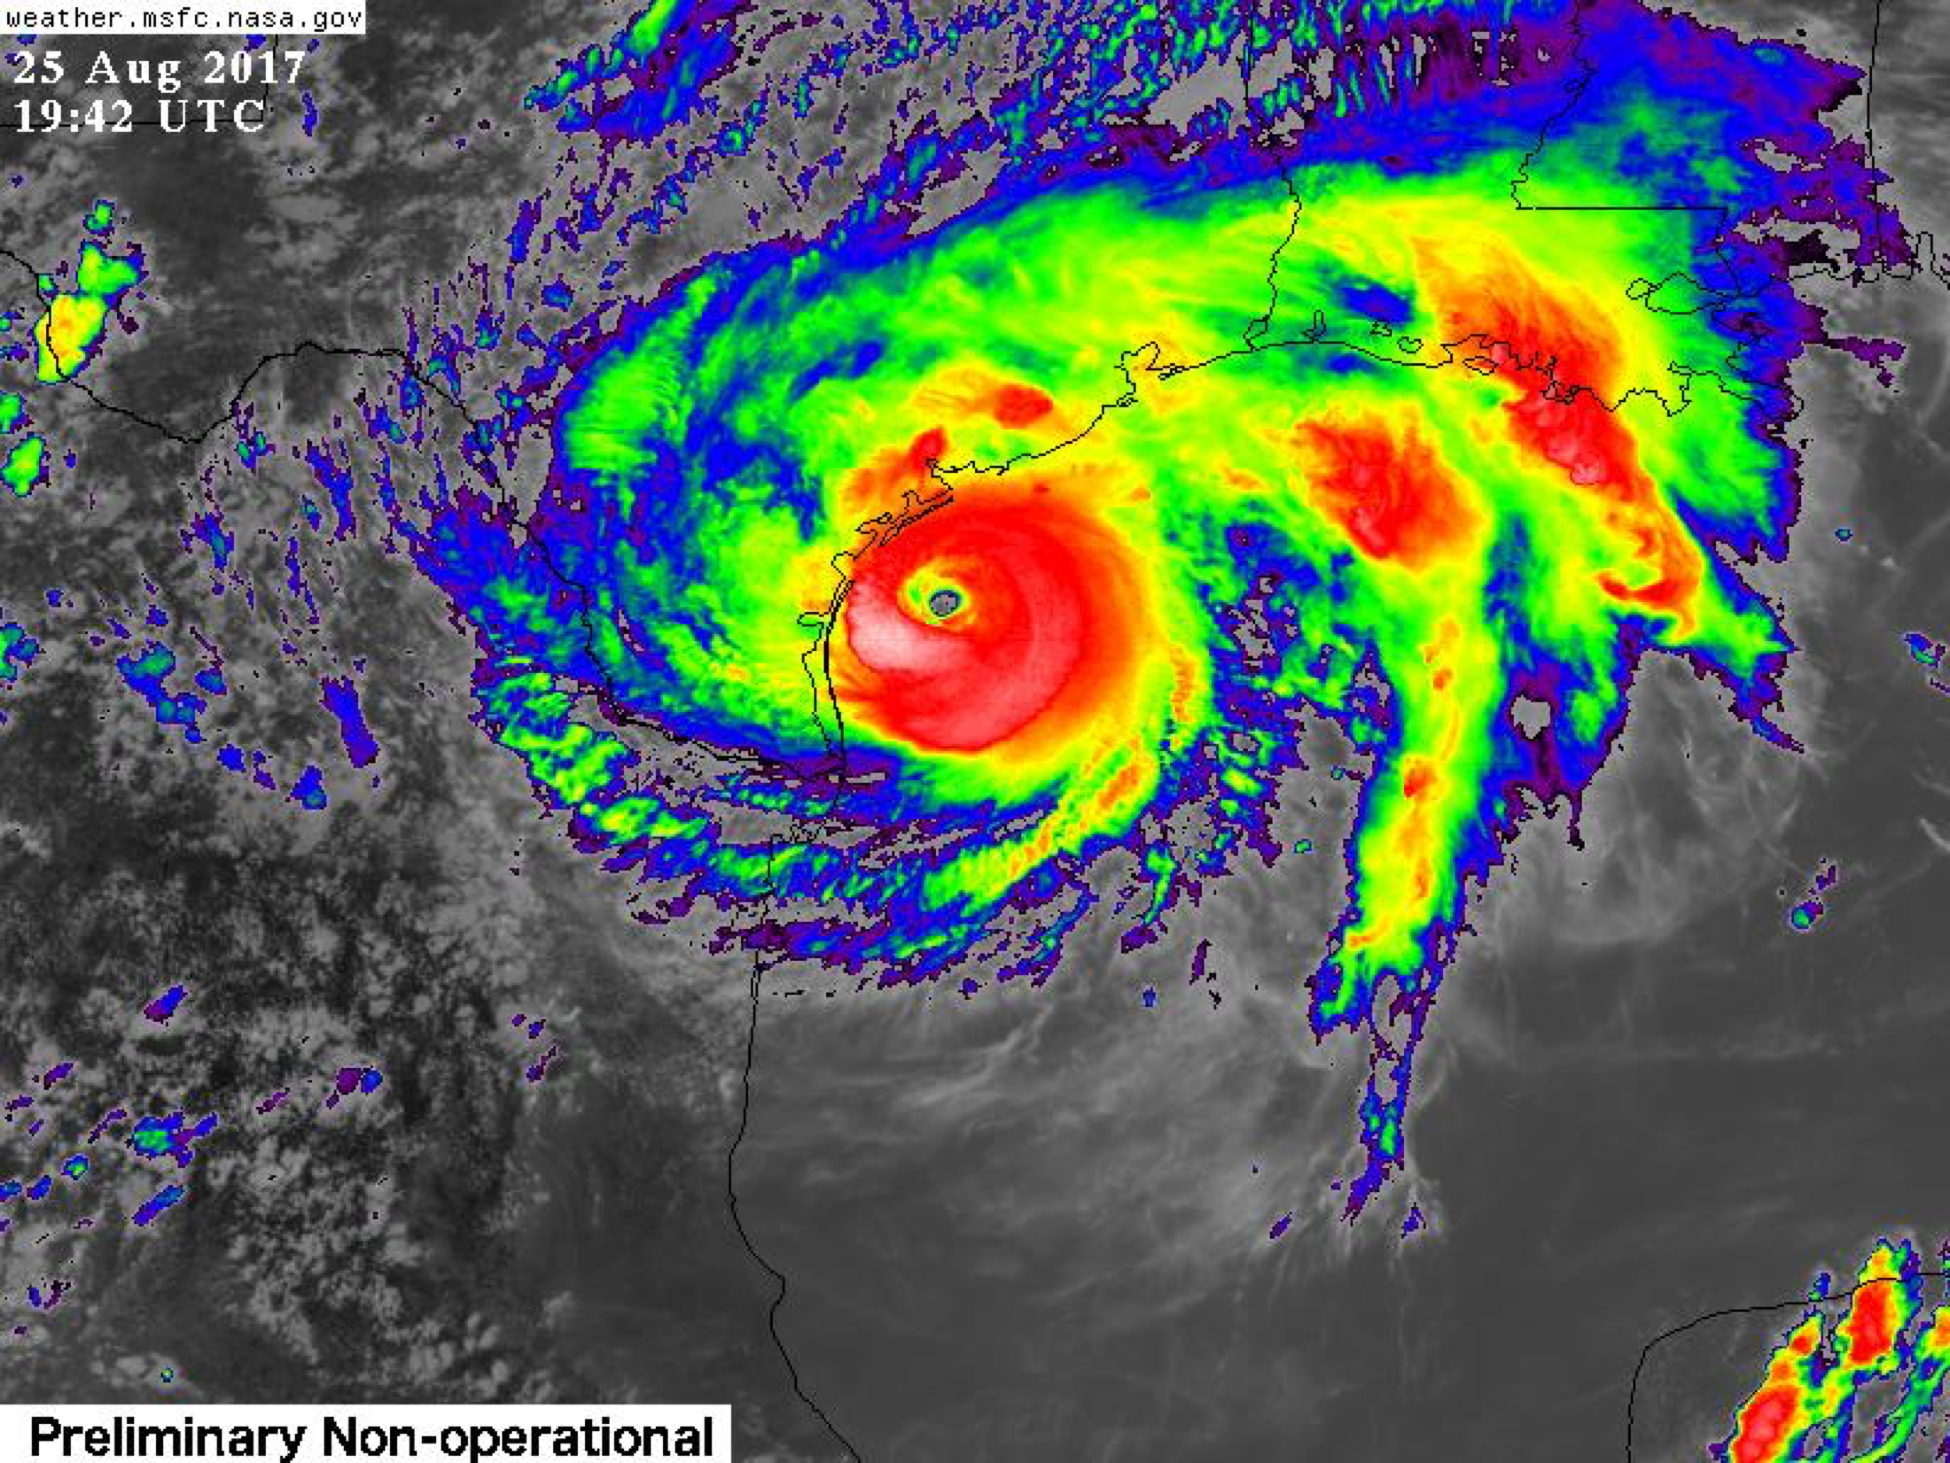
Figure 14. GOES-16 IR imagery of Harvey from 1942 UTC 25 August (image courtesy NASA MSFC, weather.msfc.nasa.gov) |
Throughout the ocean winds portion of the mission, the eye cleared (Figs. 13, 14), and it was apparent that Harvey had continued to intensity during the mission. Sweeps from the LF indicated that during the module the most intense precipitation was in the northern and western eyewall. After our departure, NHC increased the maximum surface wind speed to 115 kt.
Mission Evaluation/Problems:
Overall, the mission successfully produced 2 TDR analyses for transmission to EMC, as well as completed 2 fixes of the center for NHC (flown at 10 and 8 kft, respectively). Harvey's maximum sustained surface winds intensified from 95 kt at the beginning of the mission (1500 UTC), to 115 kt by the end (0000 UTC 26 August). Harvey had, therefore, experienced a second RI period. Although RI was also observed the previous day (24 August), the intensification that occurred during this mission was considered to be a separate event as an eyewall replacement cycle apparently occurred between the two P3 missions on 25 August (170825H1 observed secondary eyewall formation). While this mission observed a secondary eyewall on the initial center pass, the ERC apparently completed during the mission, and Harvey thereafter continued to intensify all the way to landfall north of Corpus Christi. A broadening of the wind field compared to the previous mission was also observed.
Only 1 of the 4 AXBTs reported any good data. ASPEN crashed during the flight, but Brad was able to get it back to finish QC'ing the remainder of the sondes. Other than these two issues, no other problems were encountered.
Jon Zawislak
August 30, 2017
 Flight track |
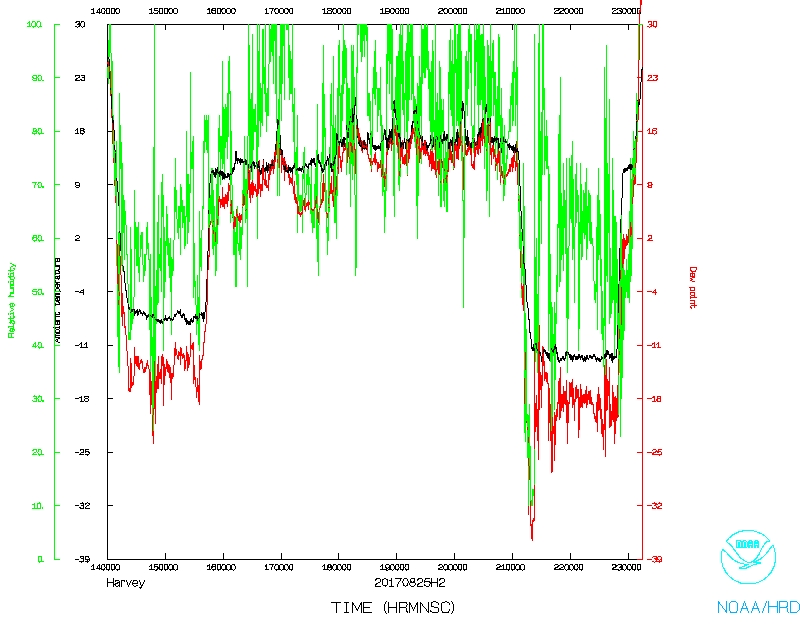 Temperature and Moisture |
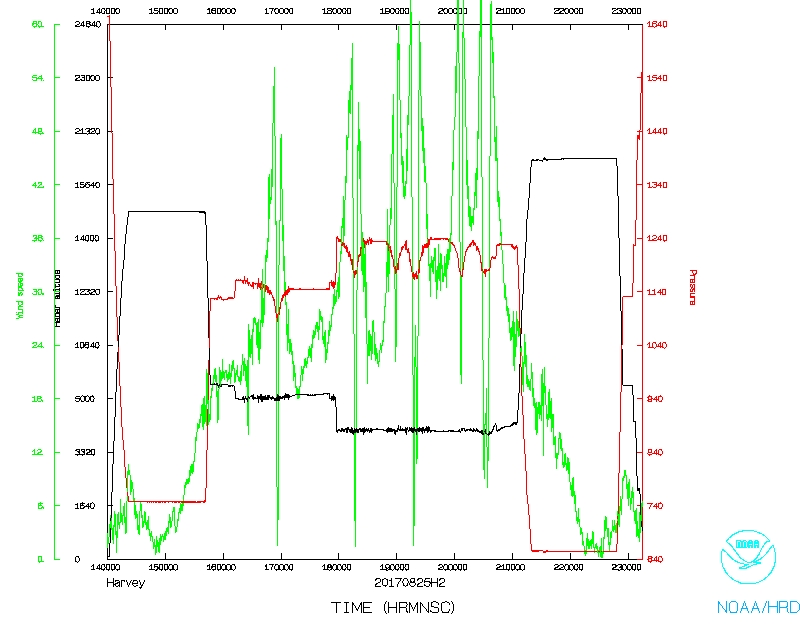 Wind and Atlitude |
 Flight track detail |
LPS log |
Drop log
Flight Director's manifest
NetCDF data |
SFMR data |
1 second data