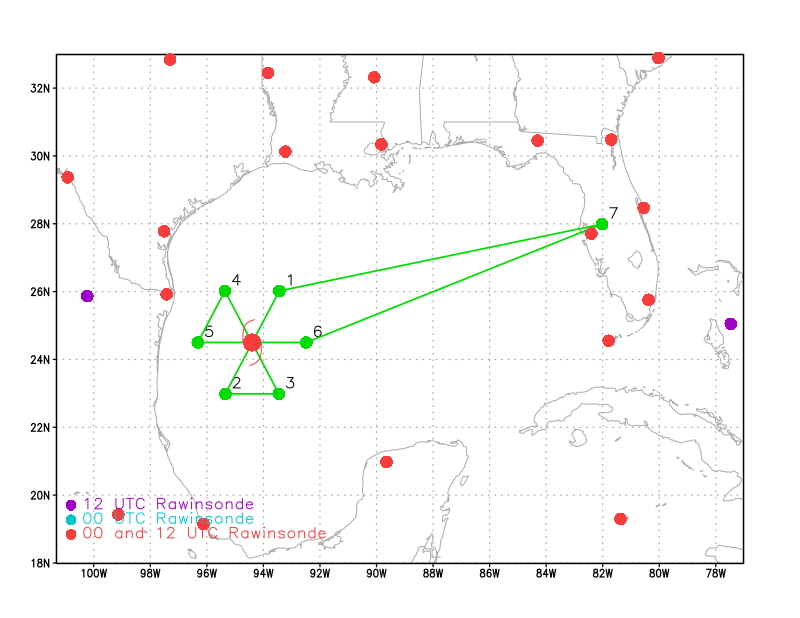
Figure 1. Proposed flight track for mission 20170824H2 |
| Aircraft Commander | Justin Kibbey |
| Co-pilot | Danny Rees |
| Co-pilot | Nate Kahn |
| Flight Engineer | Ken Heystek |
| Flight Engineer | Richard Souza |
| Navigator | Pete Freeman |
| Flight Director | Mike Holmes |
| System Engineer | Mac McAlister |
| Data Technician | Dana Naeher |
| Dropsonde Operator | Jorge Delgado |
| LPS | Zawislak | HRD |
| Radar | Leon Nguyen | HRD |
| Dropsonde | Brad Klotz | HRD |
| LPS | Paul Chang | NESDIS |
| Observer | Dave Ryglicki | NRL |
| Guest | Raymond Scheflett III | Wimberly View |
| Guest | Raymond Scheflett IV | Wimberly View |
| Public Affairs | Kevin Doremus | AOC |
Mission Plan :
|
Figure 1. Proposed flight track for mission 20170824H2 |
NOAA 42 will conduct a butterfly pattern at 10 kft (although the altitude may be adjusted for de-confliction with Teal) with 105 nmi inbound/outbound radial legs (Figure 1). 6 dropsonde (9 total for entire pattern) / AXBT combos will be launched at each turn point in the pattern, as well as dropsondes only on the center passes (3, NHC). NHC is requesting an 1800 UTC fix on the 2nd pass. SHIPS shear, as of 1200 UTC analysis is 253° / 8 kt. The NHC advisory at 11 am EDT / 1500 UTC: Motion, 340 / 9 kt; Intensity, 55 kt (gusts to 65 kt), 982 mb; Position, 24.0°N / 93.3°W. The most recent fix from the USAF is 23°49' N / 93°08' W at 1304 UTC.
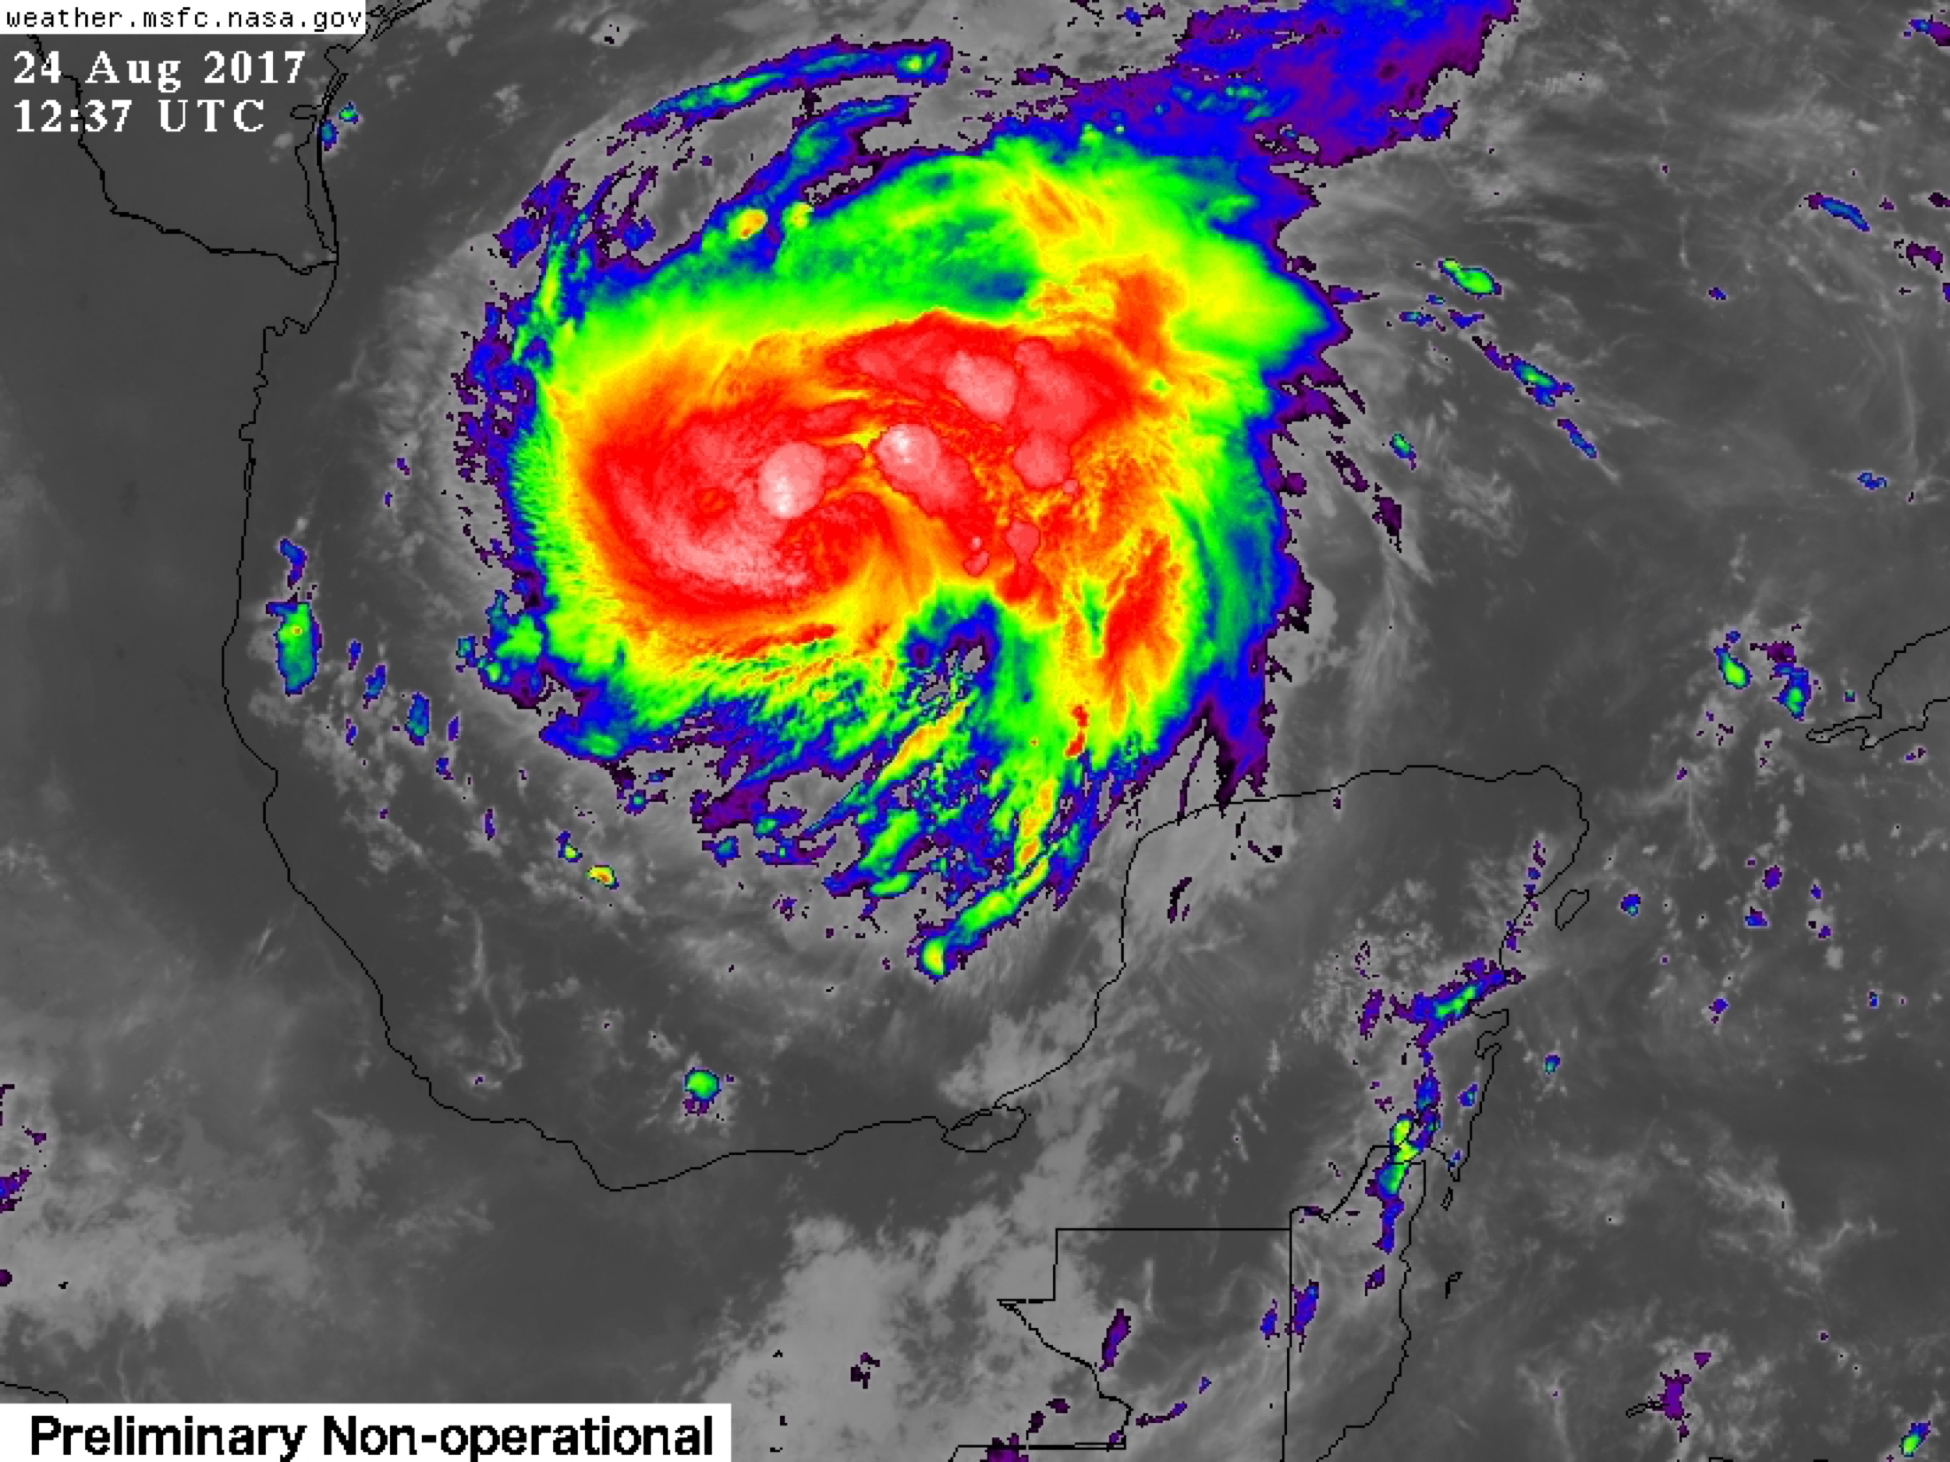
Figure 2. GOES-16 IR imagery of Harvey from 1237 UTC 24 August (image courtesy NASA MSFC, weather.msfc.nasa.gov) |
The satellite presentation of Harvey has markedly improved throughout the morning as a large central dense overcast is present. Deep convection has been fairly persistent since the overnight diurnal maximum, and is likely very concentrated around the low-level center (Fig. 2). As deep convection has developed, it appears to traverse from the downshear right quadrant to the downshear left, and finally the upshear left quadrant. Passive microwave imagery (Fig. 3) indicates that an inner eyewall is becoming more closed. Water vapor imagery indicates that any influence from the dry air previously present to the southwest of the storm yesterday (23 August) is no longer a factor (if it was at all). Overall, the IR satellite loops, as well as PMW imagery, suggest that Harvey's azimuthal precipitation within the inner core is very quickly becoming symmetric. This is consistent with the fact that the deep-layer vertical wind shear (as diagnosed from the CIMSS analysis, Fig. 4) indicates that Harvey is in a very favorable, low-shear environment. Given the current satellite presentation and trend towards increased precipitation symmetry, as well as the favorable environment that the storm is experiencing, Harvey is most certainly intensifying and is very likely to be at hurricane strength when we arrive on station.
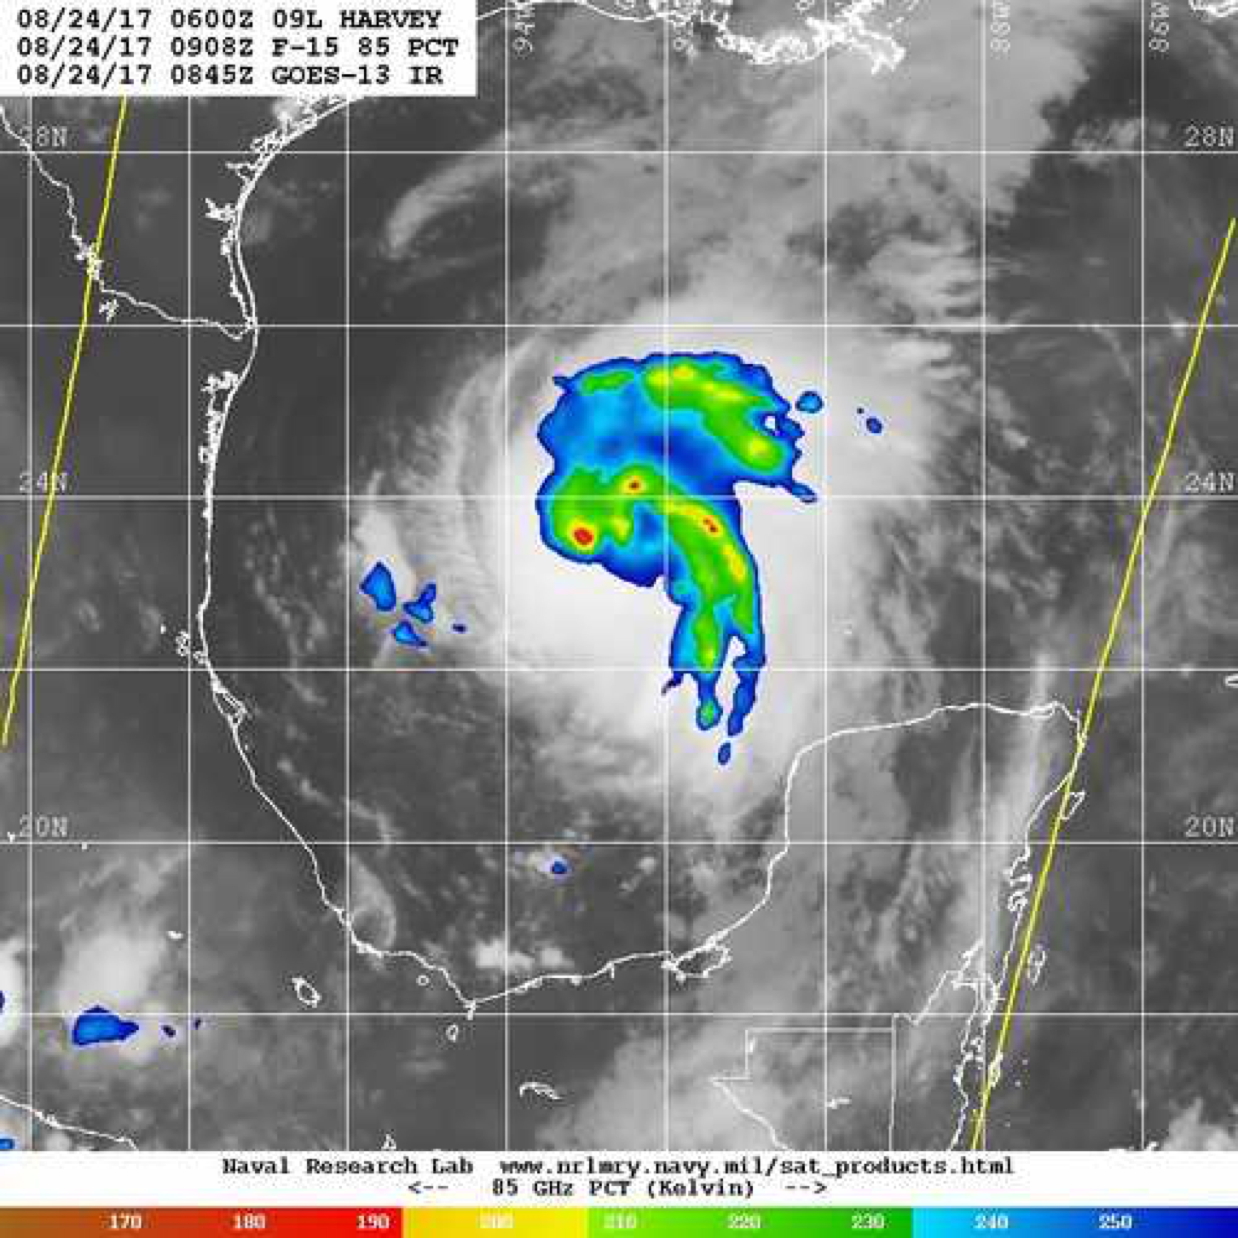
Figure 3. 85-GHz polarization corrected temperature (PCT) from an SSMI-15 overpass at 0908 UTC 24 August (image courtesy the Naval Research Laboratory, nrlmry.navy.mil/TC.html) |
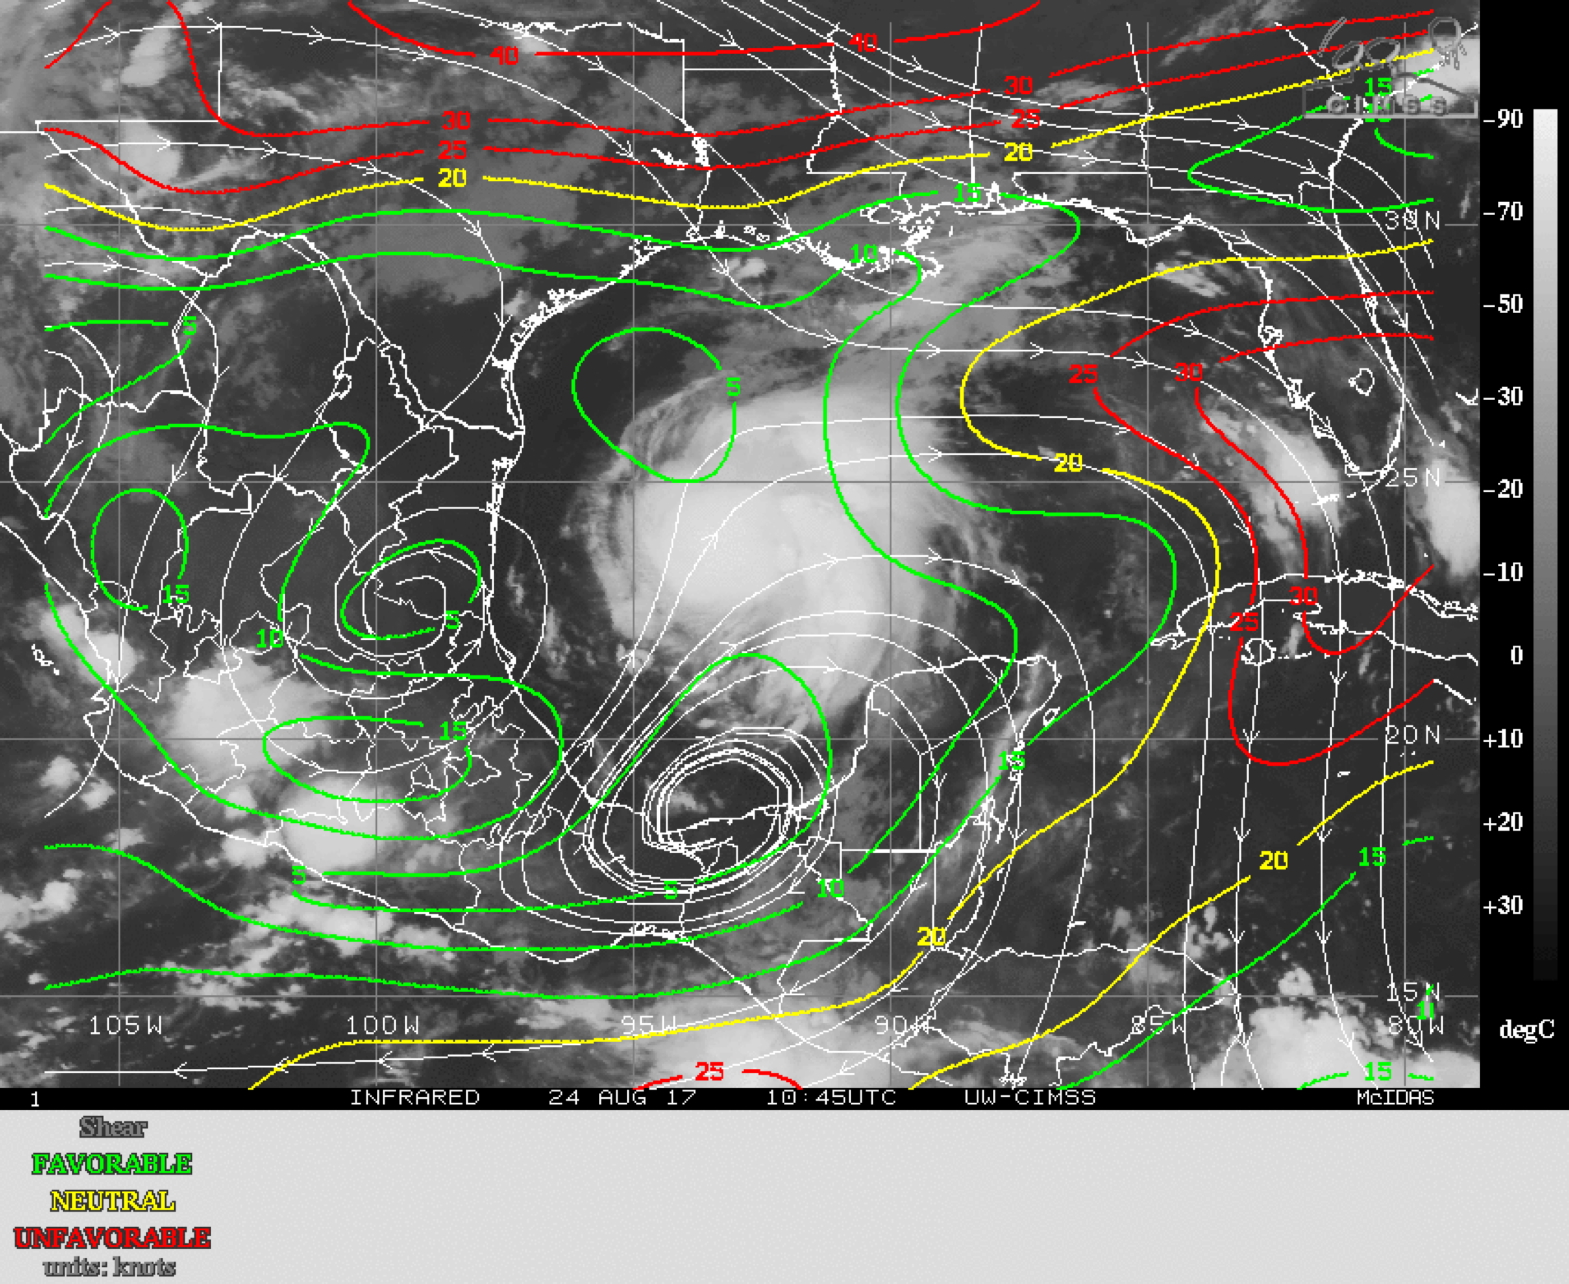
Figure 4. IR imagery and CIMSS-derived deep-layer (850-200-hPa) vertical wind shear (contoured; contours colored by favorability for intensification, with green being 'favorable', yellow being 'neutral', and red being 'unfavorable'), valid at 1045 UTC 24 August (images courtesy CIMSS, tropic.ssec.wisc.edu) |
The model consensus is for Harvey to strengthen (Fig. 5) as it continues on northwest track through the western Gulf of Mexico (Fig. 6). Although most of the model guidance suggests that Harvey will peak as a strong Category 1 hurricane prior to its potential landfall southern Texas, SHIPS predictors indicate strongly the RI may occur over the next 24-48 hours.
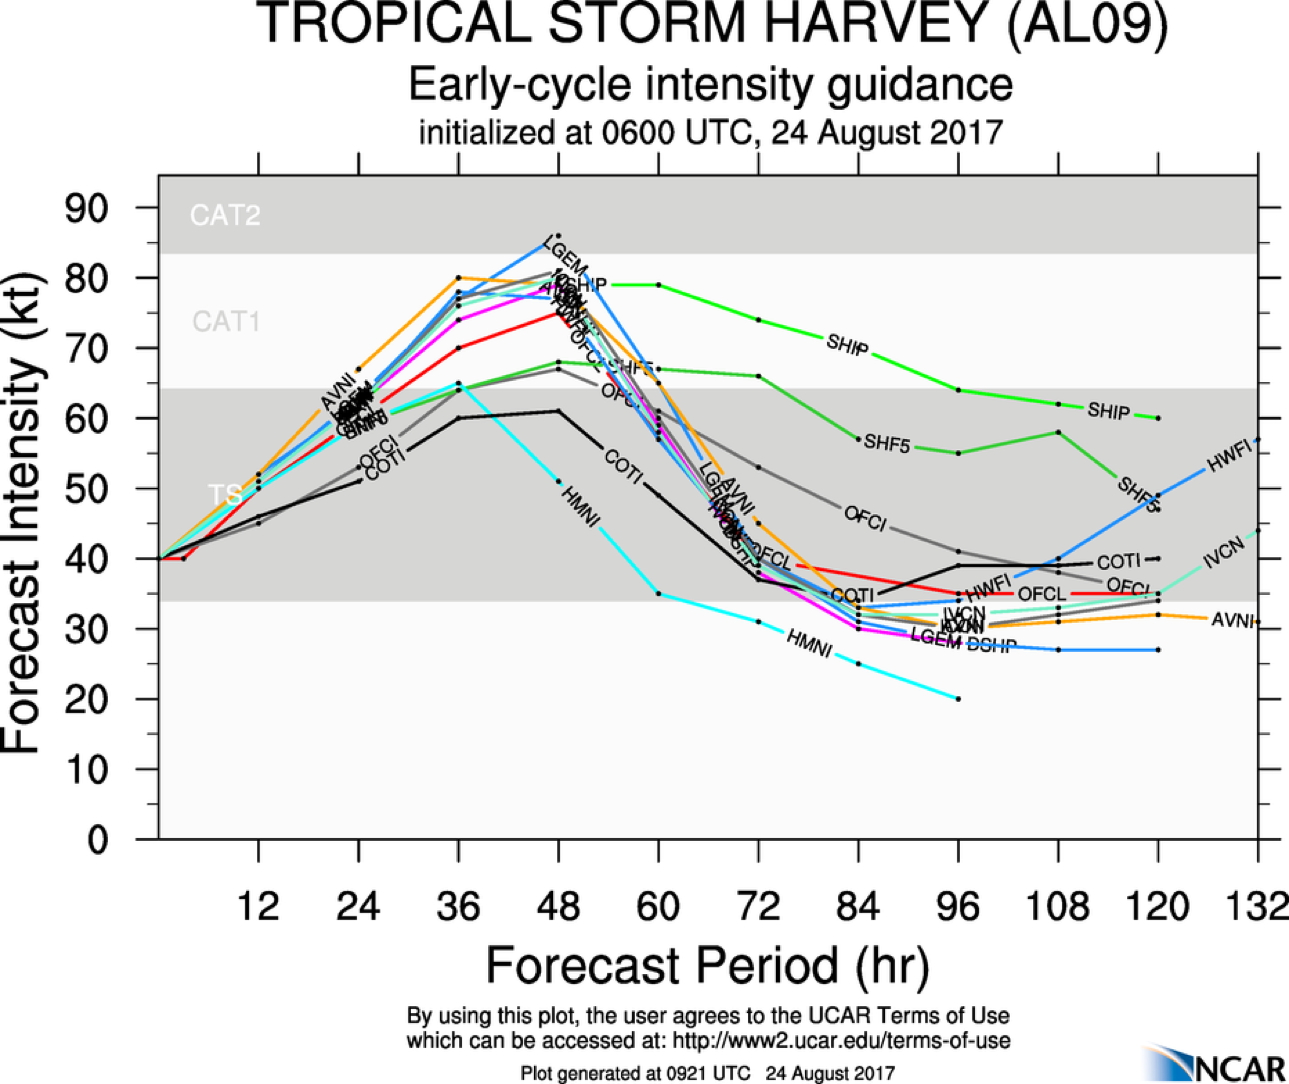
Figure 5. Intensity forecast guidance for Tropical Storm Harvey valid 0600 UTC 24 August (image courtesy http://www.ral.ucar.edu/guidance/realtime/current/) |
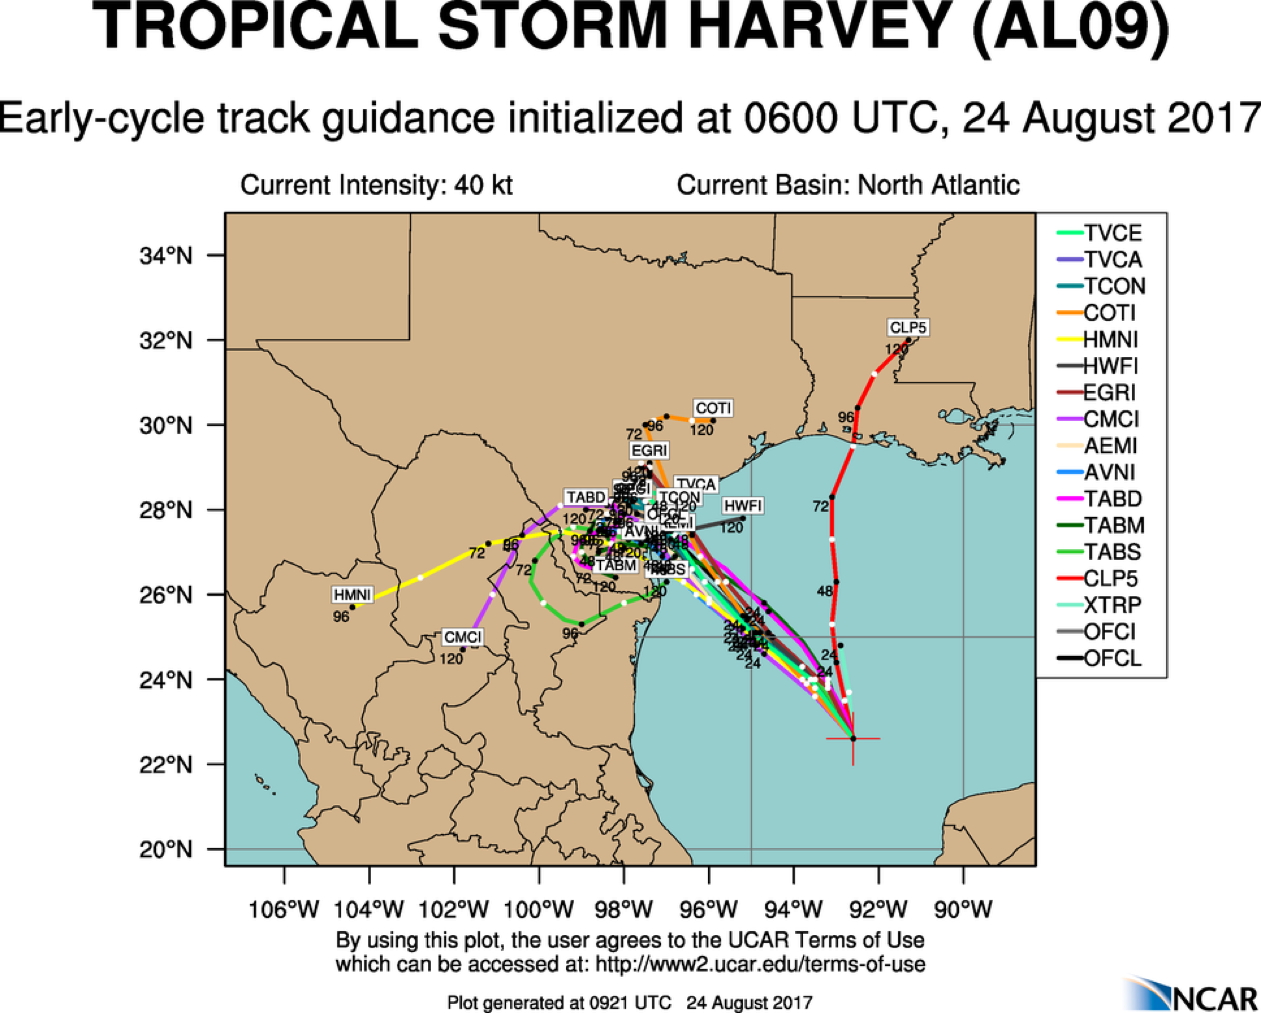
Figure 6. Track forecast guidance for Tropical Storm Harvey valid 0600 UTC 24 August 2017 (image courtesy http://www.ral.ucar.edu/guidance/realtime/current/) |
Mission Summary :
| Take off | Landing
| Linder-Lakeland Airport, FL
| 14:36 UTC
| Linder-Lakeland Airport, FL
| 22:23 UTC
| Penetrations
| 3
| Expendables
| 9 Dropsonde (6 HFIP, 3 NHC), 6 AXBTs
| | ||||||
Takeoff (1435 UTC) was slightly delayed (originally planned for 1400 UTC / 1000 EDT) due to an SFMR swap and to diagnose an issue with the SFMR processor onboard (the issue was that processor would randomly power off, but this did not occur during the mission). Enroute to the IP the LPS, radar scientist, and ground radar scientist (Reasor) evaluated whether the aft (slave) antenna was working since the previous mission (170824H1) determined that the aft antenna was not producing velocity data (though it did appear to have reflectivity) during their flight. Checks for consistency between the fore and aft scans (which can be toggled on the TDR display software on the workstations) were successful during both clear air portions of the transit (similar velocity returns close to the aircraft), as well as 'rainy' portions, which generally consisted of anvil and shallow to moderately deep congestus clouds within range of the radar. As the file sizes were also consistent between fore and aft, we concluded that there were no issues with the TDR and proceeded to the IP.
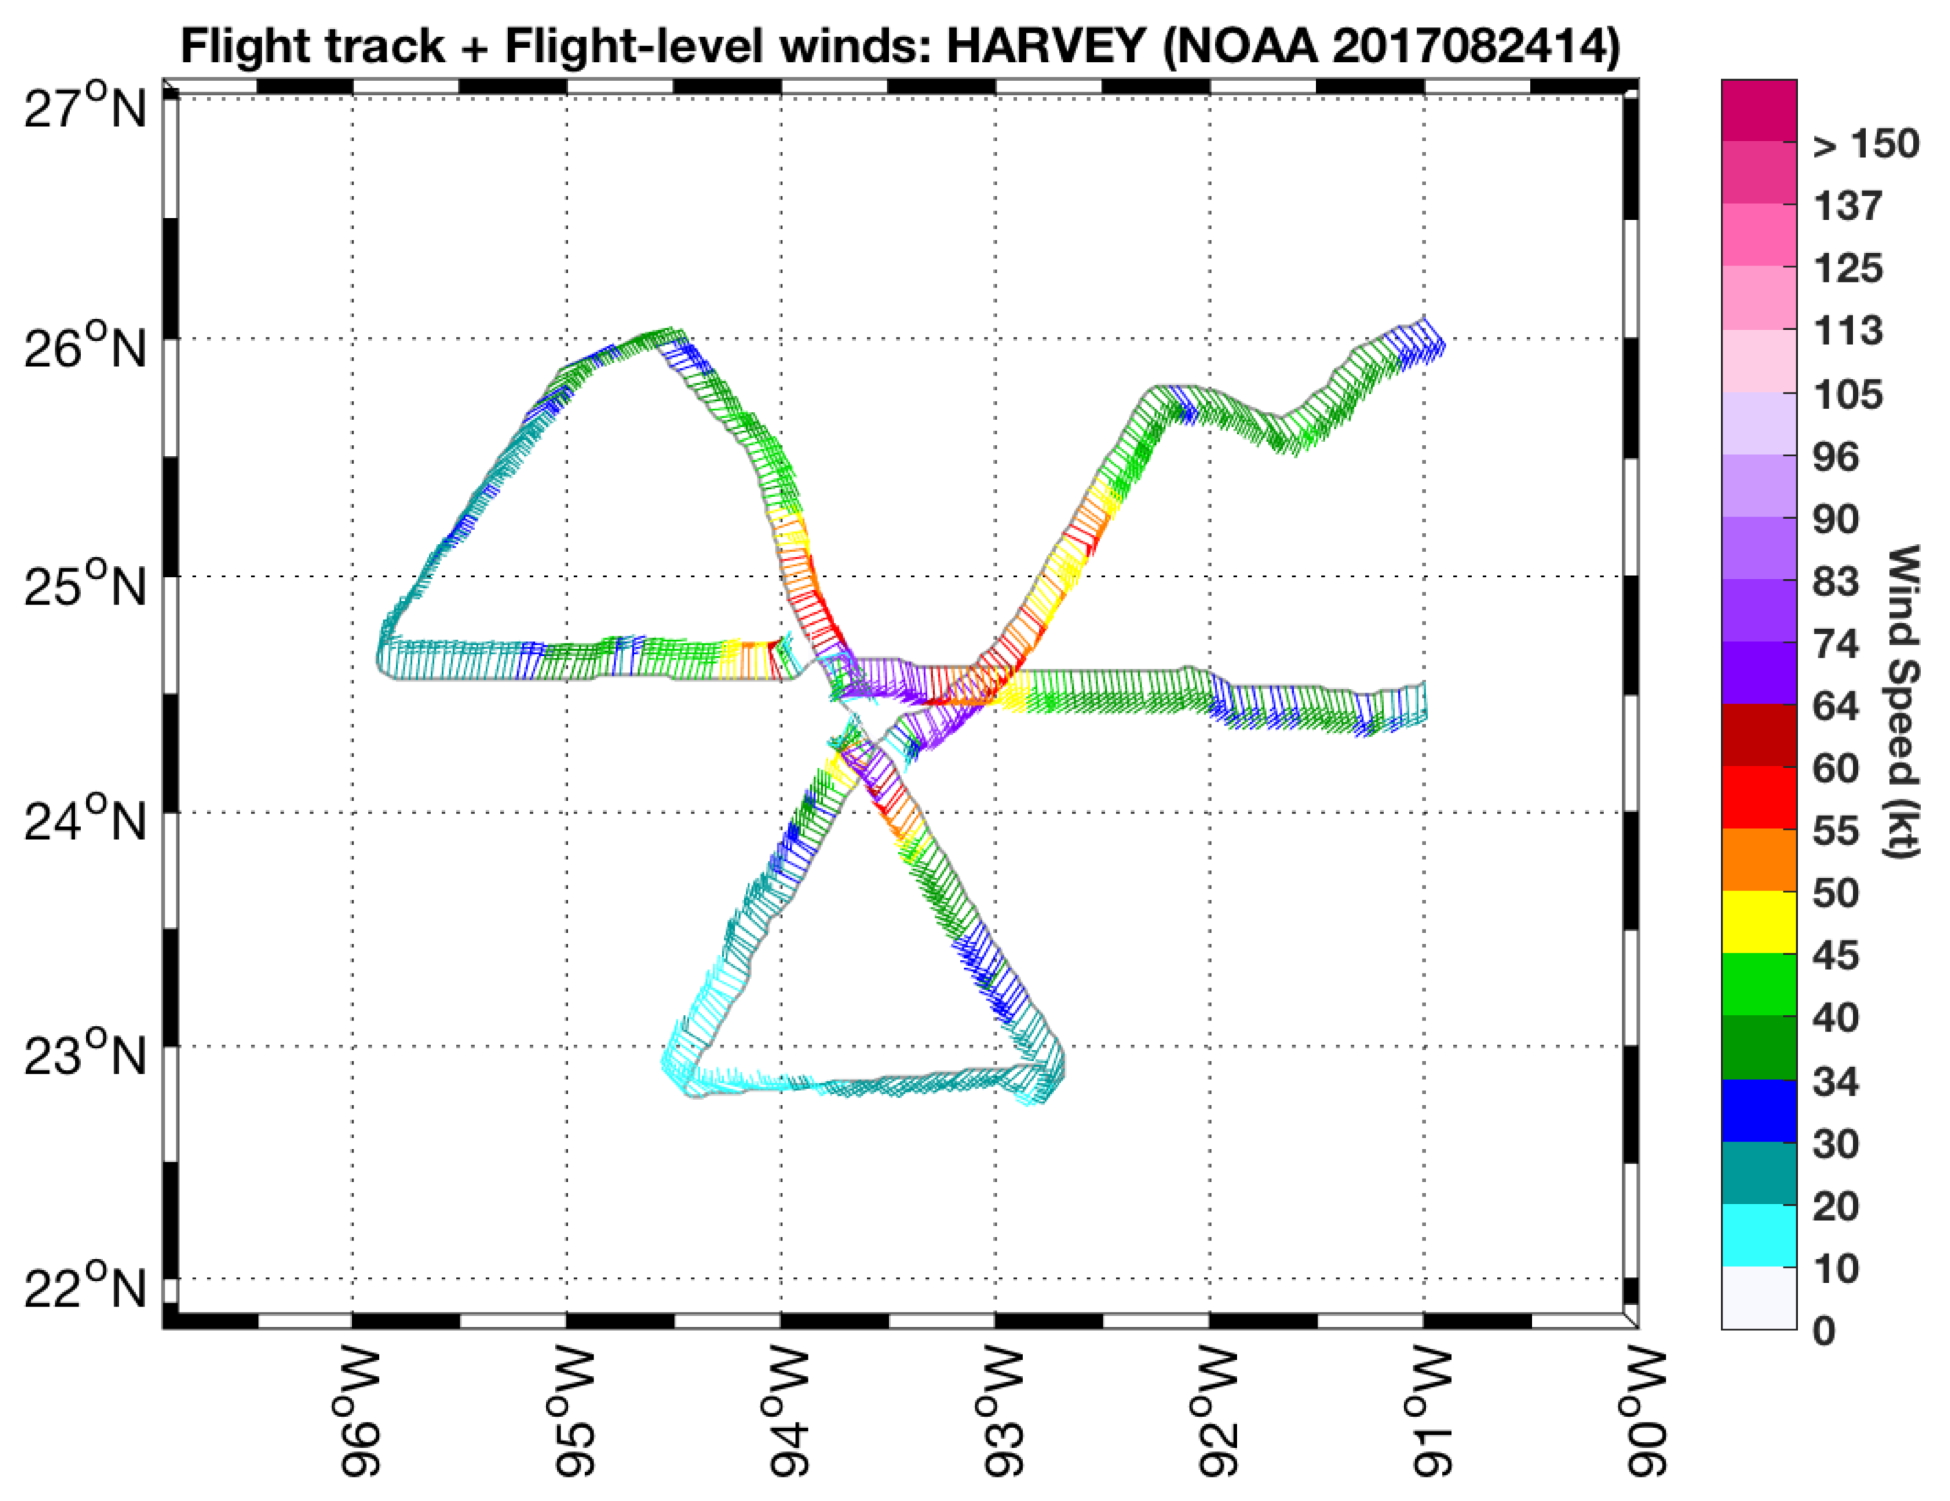
Figure 7. Actual flight track for mission 20170824H2. Flight-level winds (barbs) and wind speeds (shaded, kt) indicated. |
The actual track flown by N42 is shown in Fig. 7. While inbound to the IP, we were given instruction by CARCAH to fix the center on all three of our planned passes. A Teal fix of the center at 1635 UTC (24°17'N / 93°28'W) indicated that Harvey had reached hurricane strength (75 kt). We encountered some fairly intense convection in the outer rain bands in the northeast quadrant close to the IP (required an early descent). TDR indicated that this convection had 30-dBZ echo tops to 16 km, and 50-dBZ echo tops as high as 7-8 km. We arrived at the IP at 1639 UTC (23°18'N / 92°20'W) and turned inbound on the 030° radial (Sonde #1/AXBT combo). The BT at the IP did not provide good data. We encountered moderate turbulence in an inner rain band and fixed the center at 1707 UTC near 24°19'N / 93°31'W (Sonde #2). On the inbound leg, we observed 75 kt FL winds and 62 kt SFMR surface winds (Fig. 8). After the fix we proceeded on our outbound leg on the 210° radial, again encountering moderate turbulence (TDR indicated 30-dBZ to 17-18 km in the developing eyewall on the SE side). It was apparent from IR satellite (Fig. 9) and LF (Fig. 10) imagery that an intense convective burst was developing on the SE side (downshear right) of the eyewall.
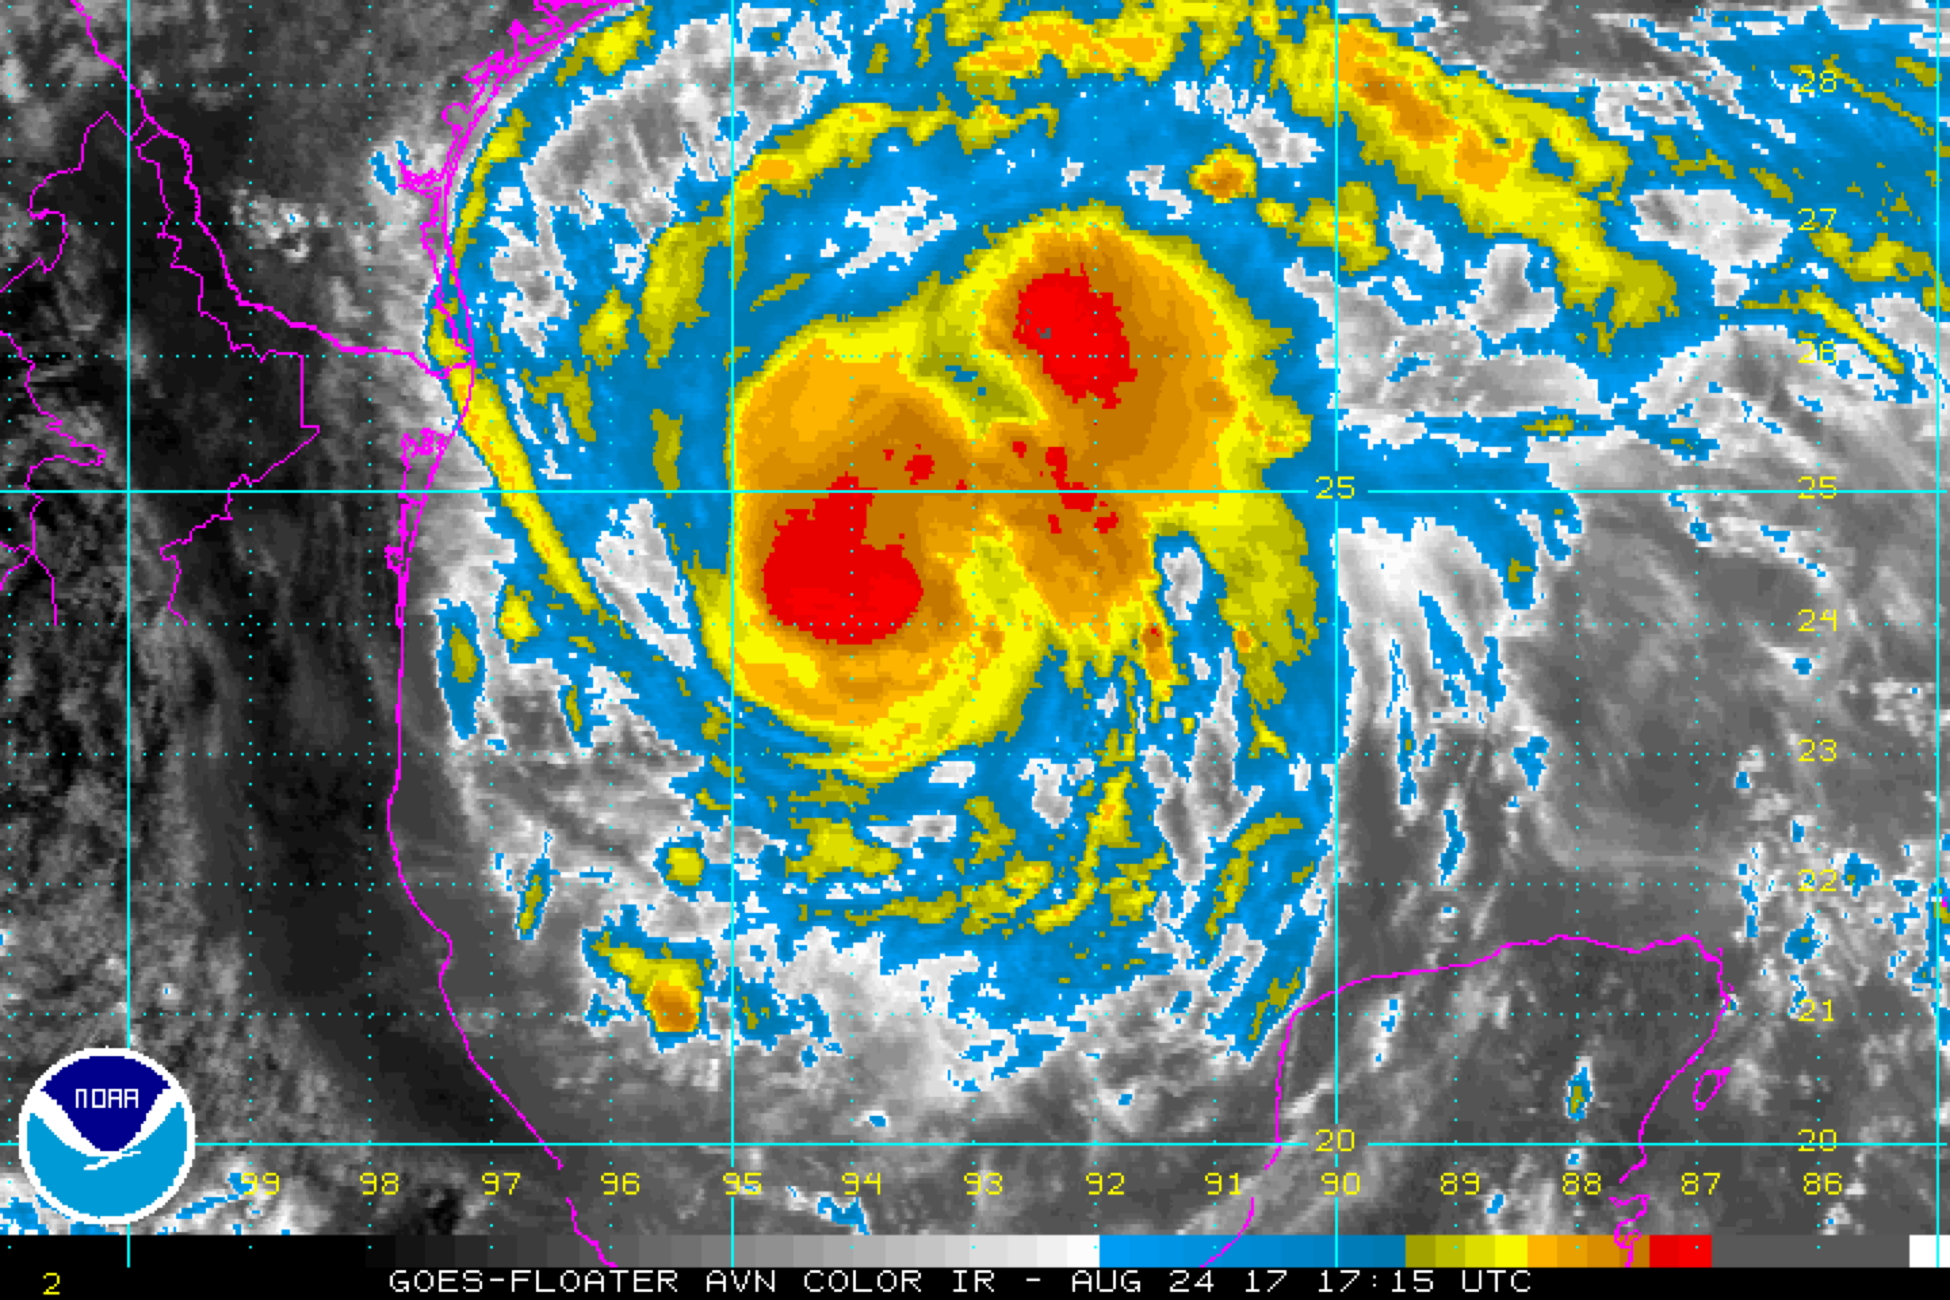
Figure 9. GOES IR imagery at 1715 UTC 24 August |
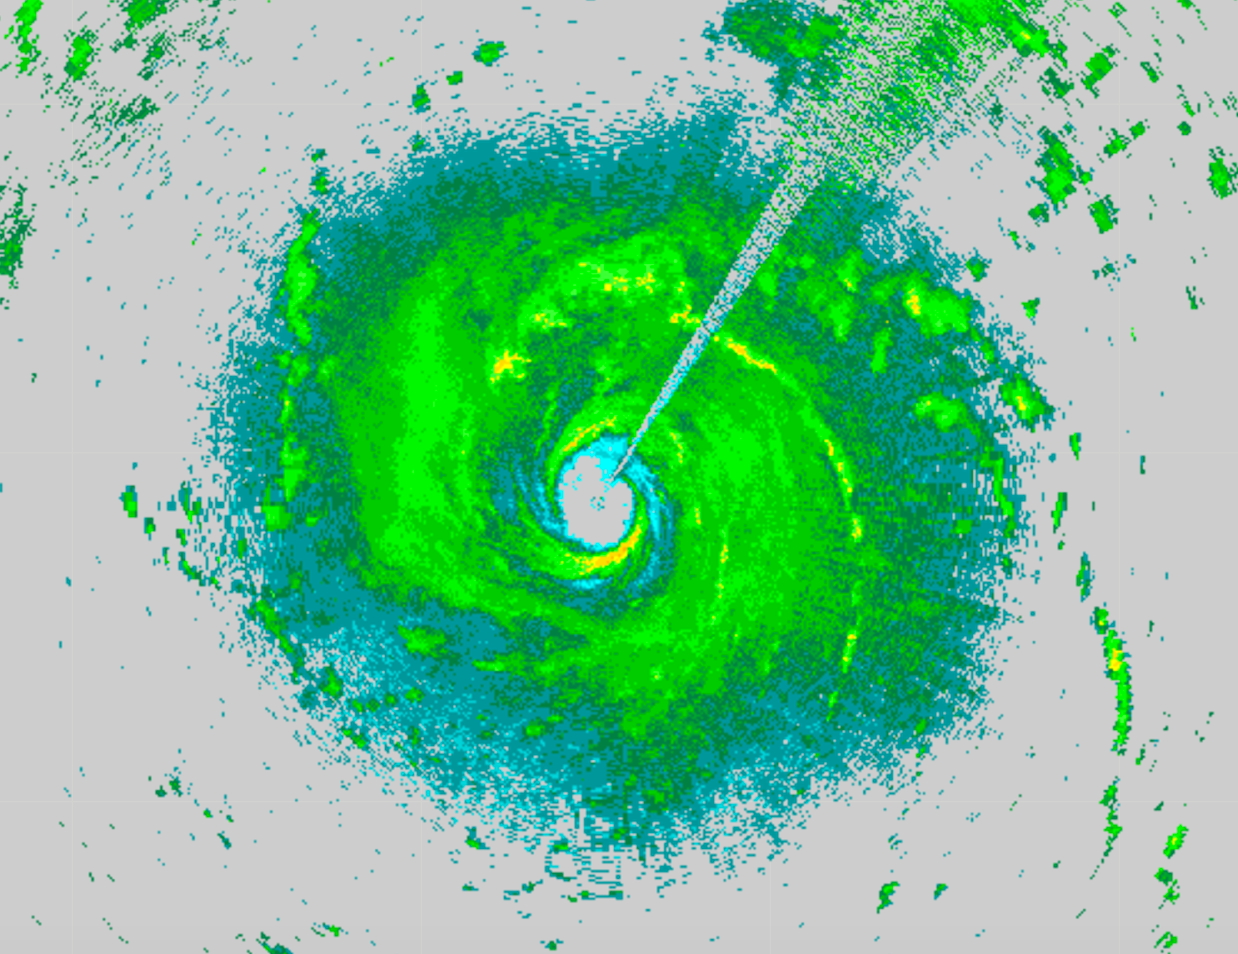
Figure 10. LF imagery at 1707 UTC 24 August |
We arrived at WP #2 around 1724 UTC (Sonde #3/AXBT) where we observed clearer conditions (anvil above, shallow cumulus topped PBL). The AXBT at WP #2 did provide good data (SST, 30.1°C). We proceeded downwind, observing similar conditions to WP #3 (1747 UTC, Sonde #4/AXBT). The AXBT at WP #3 did not provide good data.
On our inbound on the 150° radial we encountered mostly stratiform precipitation, only light turbulence, and peak flight-level winds of 80 kt. While the LF was in full scan for the first inbound/outbound, it was placed in 'wedge mode' for the remainder of the mission (with the exception when we were in the center). We fixed the center at approximately 1824 UTC near 24°26'N / 93°41'W (Sonde #5). This center dropsonde reported 977 mb at the surface. On our outbound leg (along 330°) we encountered an intense convective burst in the NE eyewall (Fig. 11, IR imagery, and Fig. 12, LF imagery) that we believe originated on the SE side on our first pass, and had since rotated cyclonically around to the NW (upshear left) eyewall. We expected that we might encounter that convective burst again on the west side of the eyewall on the next inbound for our final pass.
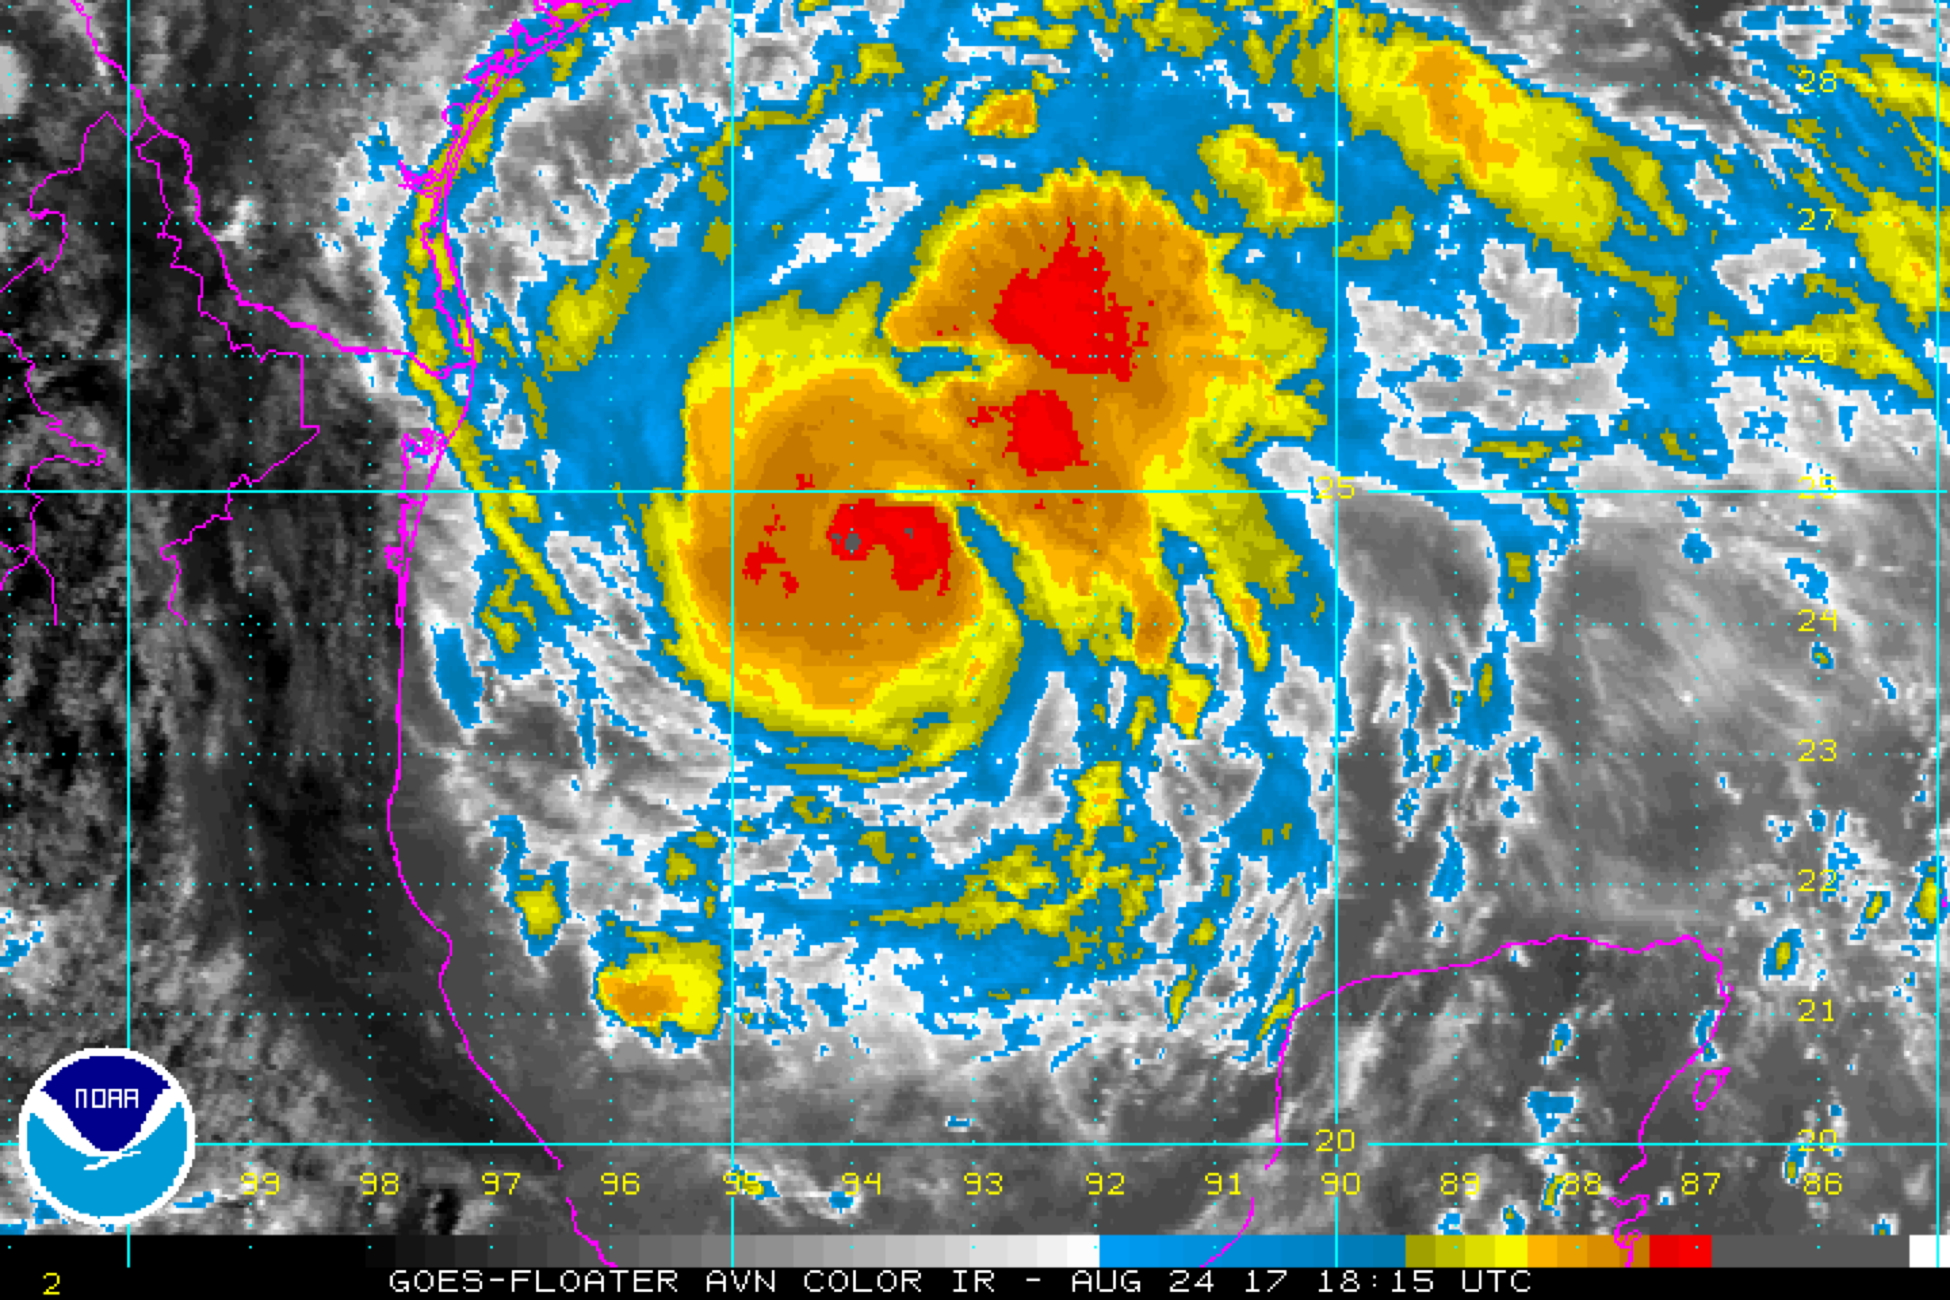
Figure 11. GOES IR imagery at 1815 UTC 24 August |

Figure 12. LF imagery at 1817 UTC 24 August |
We arrived at WP #4 at approximately 1850 UTC (Sonde #6 / AXBT). The AXBT reported good data, with an SST of 30.2°C. At WP #5 (1915 UTC, Sonde #7 and AXBT, which did not report data), we turned inbound on the 270° radial and it was apparent that the primary rainband had grown in extent on the west (upshear) side of Harvey, although much of the primary rainband was stratiform. We did, however, encounter moderate turbulence in the potential remnant of the convective burst (Fig. 13, IR imagery, and Fig. 14, LF imagery) in the western eyewall. The eyewall was now open to the S/SSE. We fixed the center at 1944 UTC near 24°38'N / 93°51'W (Sonde #8). The MSLP on the fix was 979 mb. We extended our outbound leg along the 090° radial approximately 15 nmi past originally planned WP #6 to remain straight/level through an outer rainband to the east of Harvey. We arrived at WP #6 (~120 nmi leg) around 2018 UTC (Sonde #9 / AXBT). The AXBT did report data, but we were not confident in the SST.
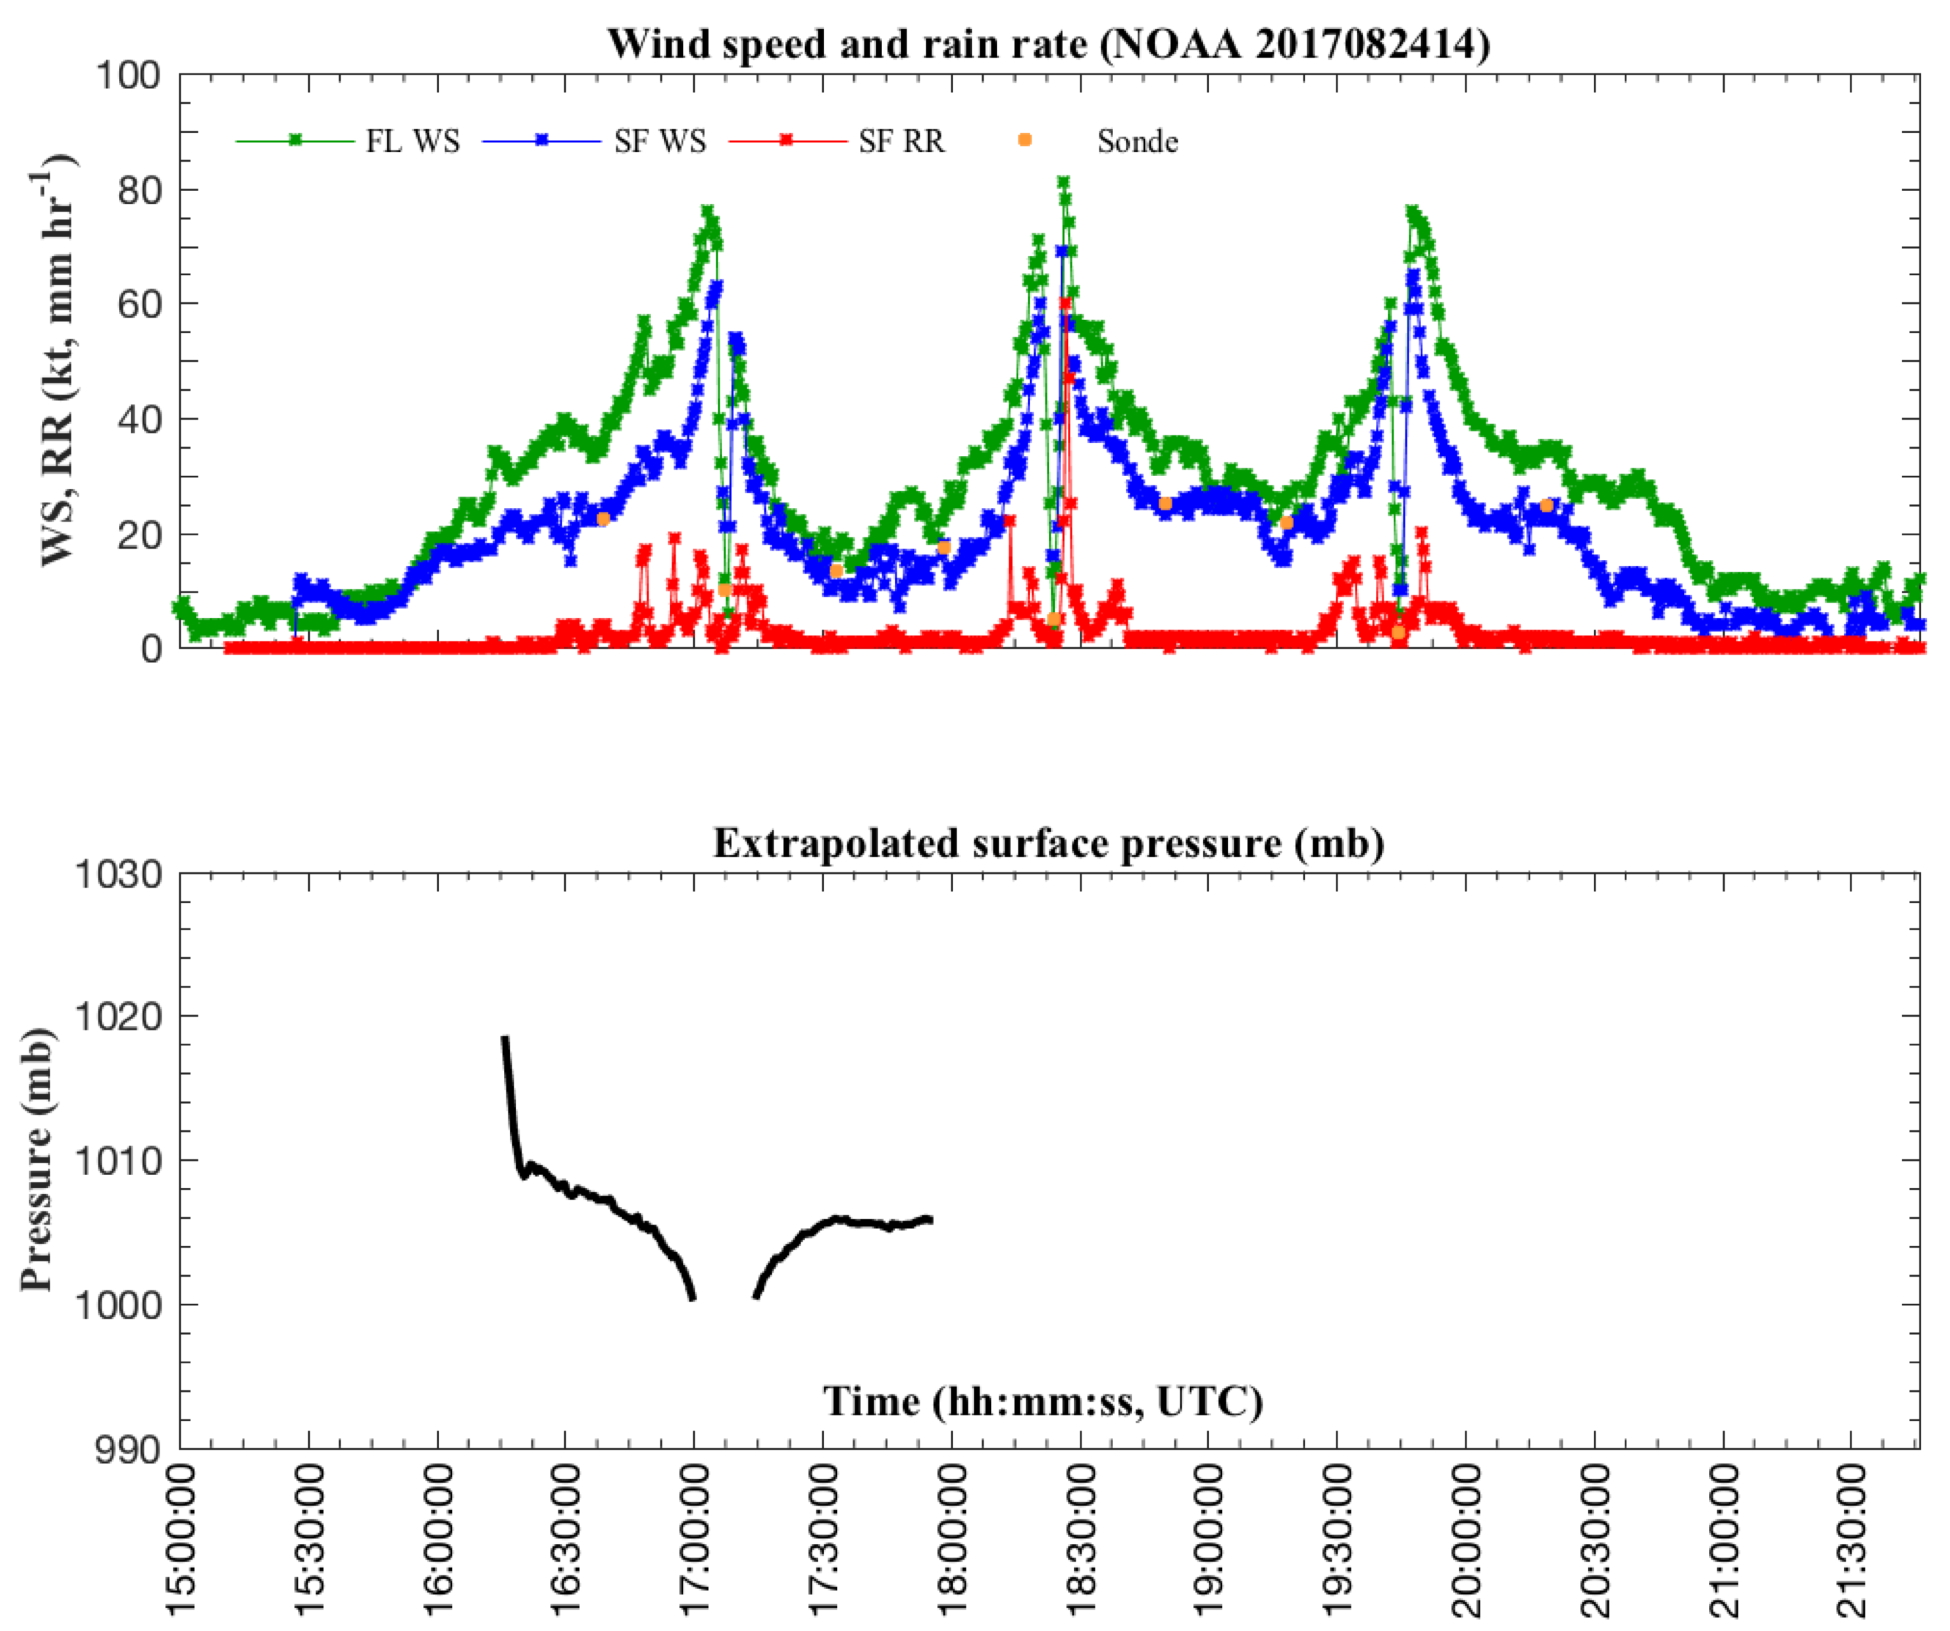
Figure 8. Time series of flight-level winds (green, kt), SFMR surface winds (blue, kt), and SFMR rain rate (red, mm/hr) for mission 20170824H2, as well as the extrapolated surface pressure (mb). |
Mission Evaluation/Problems :
Overall, the mission successfully produced 3 TDR analyses for transmission to EMC, as well as completed 3 fixes of the center for NHC (flown at 7 kft). The highest reported SFMR surface wind was about 70 kt, and flight-level wind 80 kt (Fig. 8). The mission took place during a rapid intensification period in which Harvey intensified from 55 kt to 75 kt between 1500 and 2100 UTC 24 August. It's apparent that an increase in precipitation symmetry preceded this 20 kt increase, and that a convective burst, during the course of the mission, had rotated from the downshear right (SE) quadrant around upshear (during approximately 1700-2000 UTC). Therefore, the mission potentially sampled the evolution of a convective burst as it moved around the storm.
The SFMR was swapped to another unit for this mission after the first flight (20170824H1) and, at the time of the mission, the calibration history of instrument was not known. The SFMR processor did not cause issues during the mission. The aft (slave) scan was also not an issue for this mission. As with other missions this season, the AXBTs were less successful, specifically the Ch. 14s (only 2 out of 6 reported good data).

Figure 13. GOES IR imagery at 1945 UTC 24 August |
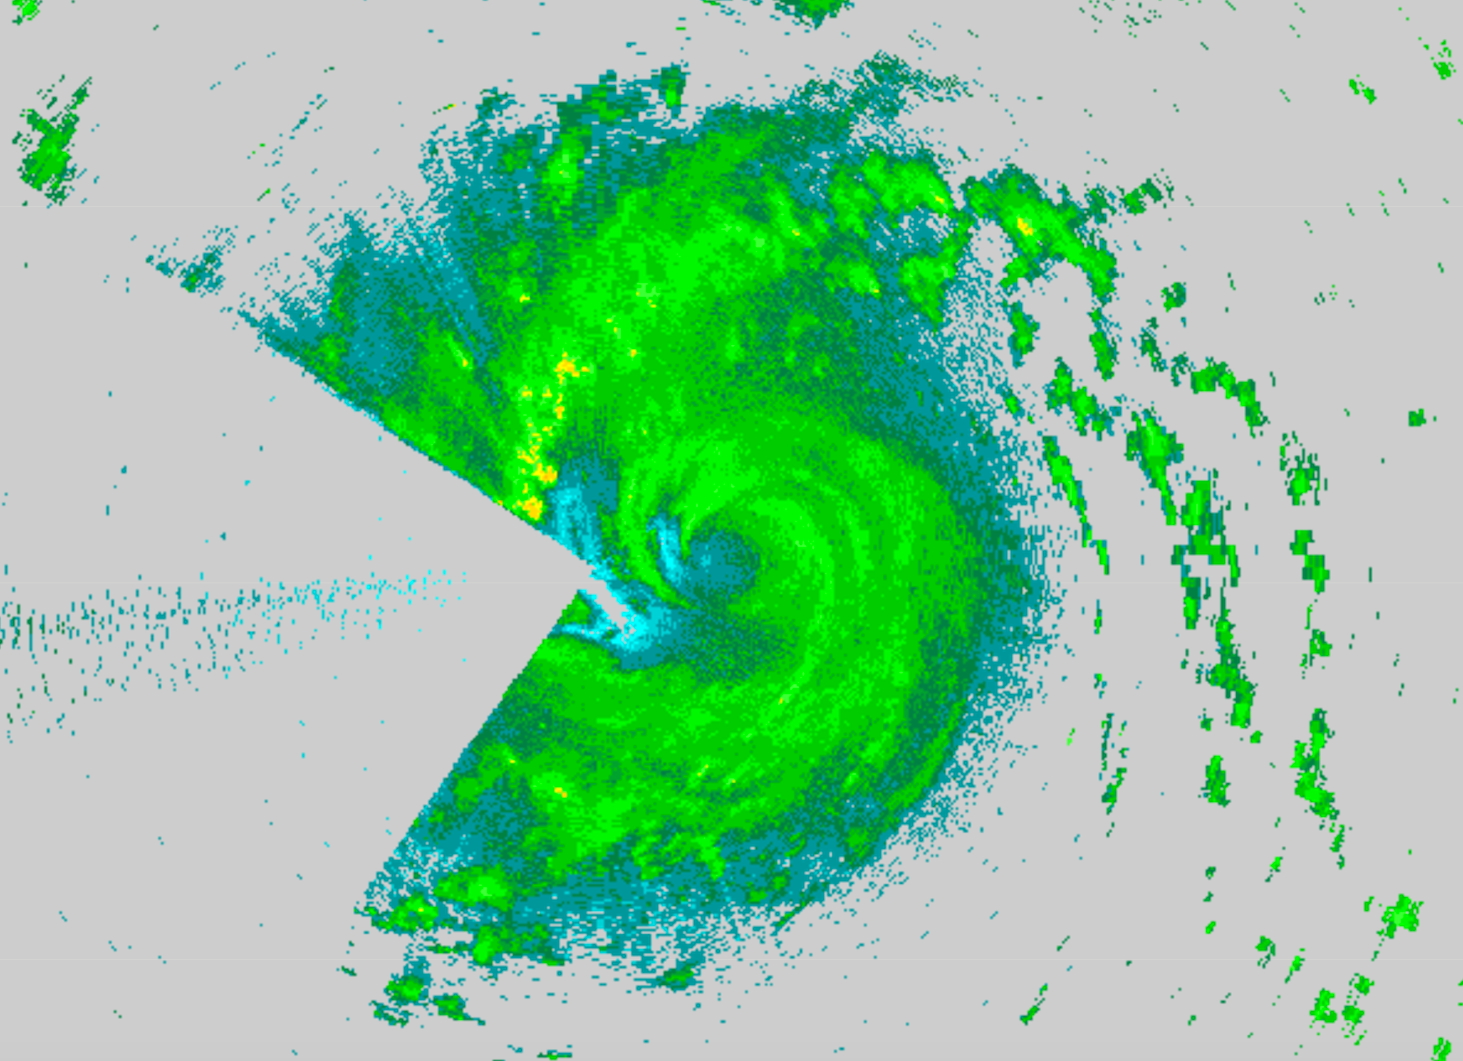
Figure 14. LF imagery at 1937 UTC 24 August |
Jon Zawislak
August 30, 2017
 Flight track |
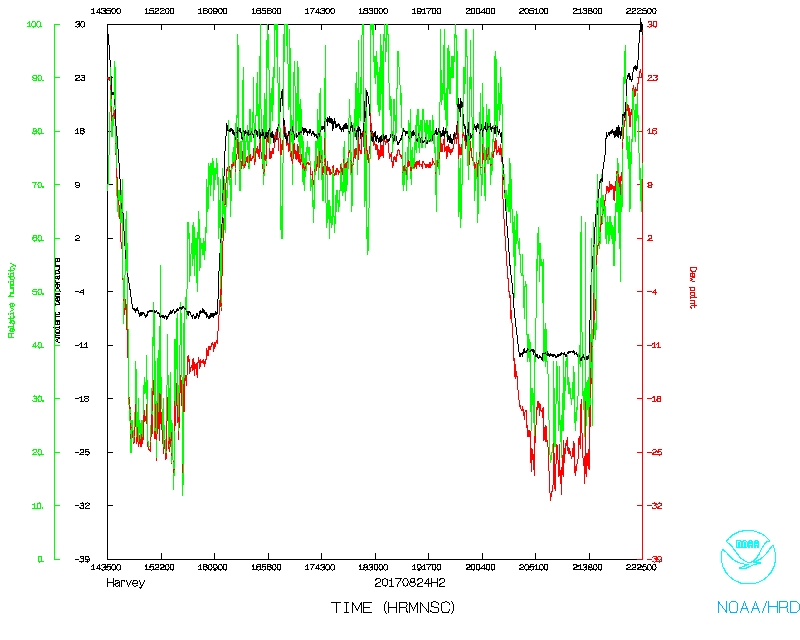 Temperature and Moisture |
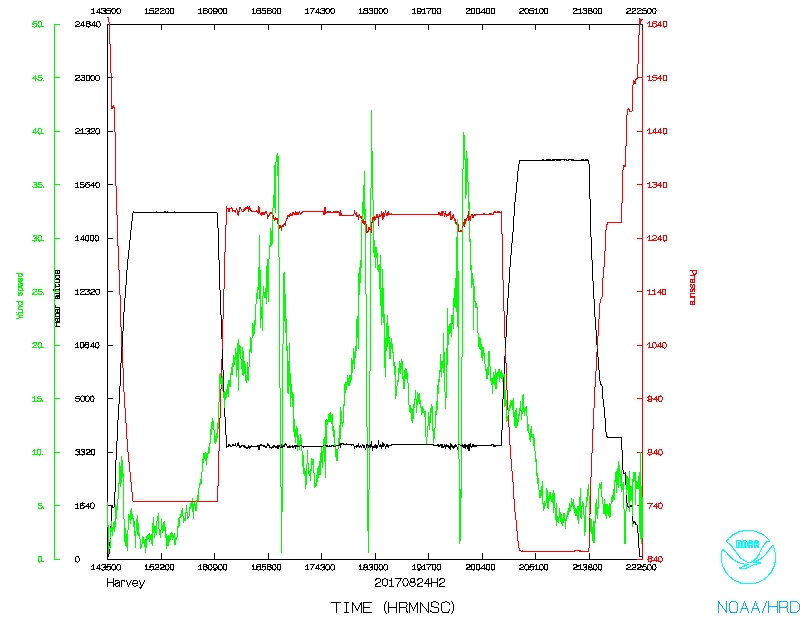 Wind and Atlitude |
 Flight track detail |
LPS log |
Radar log |
Drop log |
AVAPS log
Flight Director's manifest |
NetCDF data |
SFMR data |
One second data