 (a) |
 (b) |
|
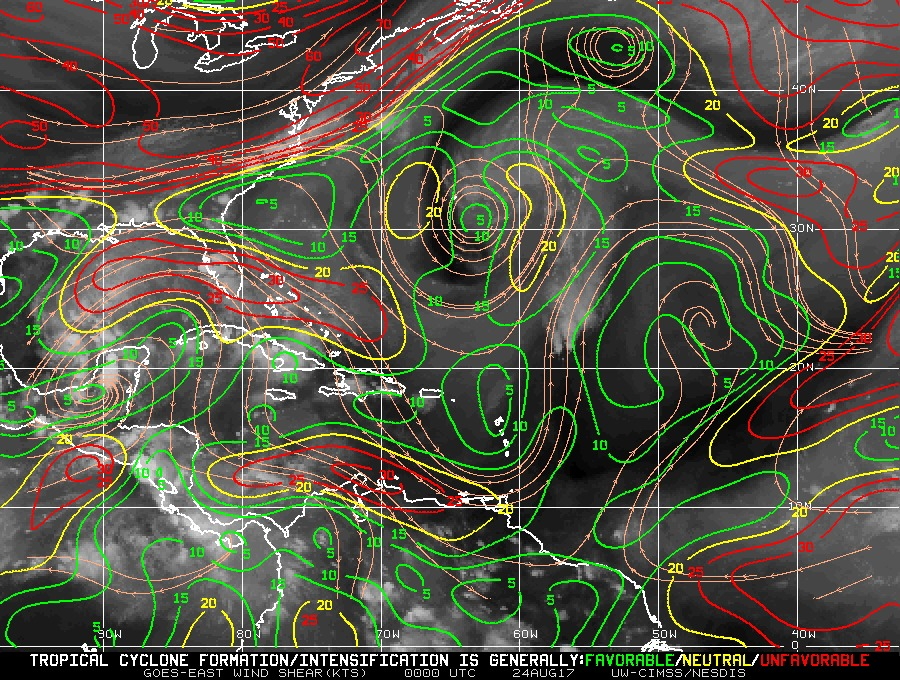
Figure 1. (a) CIMSS-derived 850-200 hPa shear (contour, kt) and GOES water
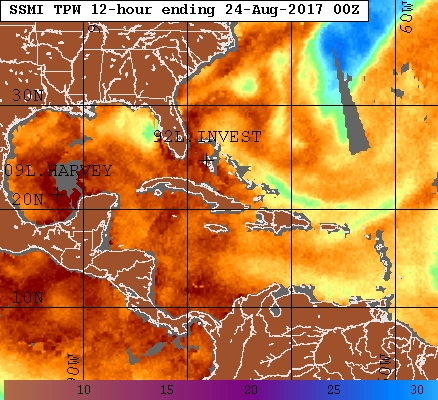
vapor image valid 00 UTC August 24; (b) SSM/I total precipitable water (shaded, mm) valid 00 UTC August 24. Images courtesy https://www.nrlmry.navy.mil/tc-bin | |
| Aircraft Commander | Scott Price |
| Co-pilot | John Rossi |
| Co-pilot | Robert Mitchell |
| Flight Engineer | |
| Flight Engineer | |
| Navigator | Sam Urato |
| Flight Director | Brian Belson |
| Flight Director | Jack Parrish |
| System Engineer | Mike Mascaro |
| Data Technician | Bobby Peek |
| Dropsonde Operator | Todd Richards |
| Lead Project Scientist | Robert Rogers | HRD |
| Radar Scientist | Jun Zhang | HRD |
| Dropsonde Scientist | Kathryn Sellwood | HRD |
| Boundary layer Scientist | Heather Holbach | HRD |
| Radar Scientist | John Gamache (ground) | HRD |
Mission Plan :
|
(a) |
(b) |
|
Figure 1. (a) CIMSS-derived 850-200 hPa shear (contour, kt) and GOES water
vapor image valid 00 UTC August 24; (b) SSM/I total precipitable water (shaded, mm) valid 00 UTC August 24. Images courtesy https://www.nrlmry.navy.mil/tc-bin | |
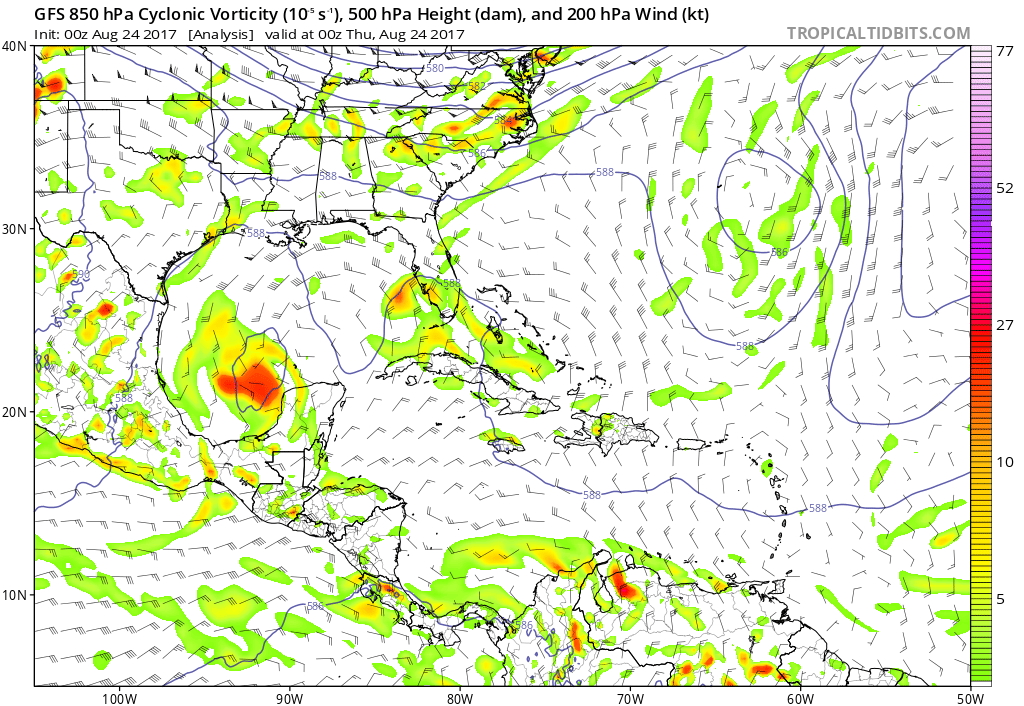
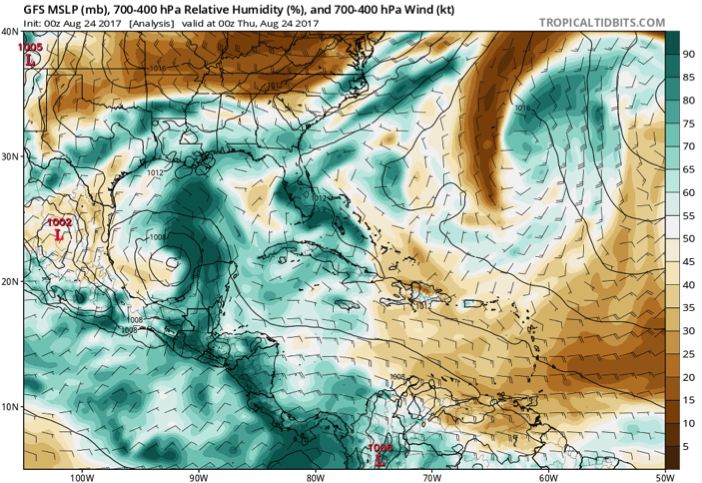
NOAA 42RF (N42) will perform a TDR mission in Tropical Depression Harvey, located in the southwest Gulf of Mexico after having emerged from the Yucatan peninsula. The storm has a broad circulation, with a lack of an inner core at this time. The environment is generally favorable, though, with light to moderate southwesterly shear and a moist lower troposphere (Fig. 1). There is an upper-level low to the west of the system along the Mexican coast (Fig. 2). This upper-level low is what is imparting the southwesterly vertical shear, as well as a region of relatively dry mid- to upper-level air on the southwest side of Harvey (Fig. 3).
|
|
Figure 2. Relative vorticity at 850 hPa (shaded, x 10-5 s-1), geopotential height at 500 hPa (contour, dm), and winds at 200 hPa (barb, kt) from GFS analysis valid 00 UTC August 24.Image courtesy tropicaltidbits.com |
 (a) |
 (b) |
|
Figure 3. (a) Relative humidity averaged in the 700-400 hPa layer (shaded, %)
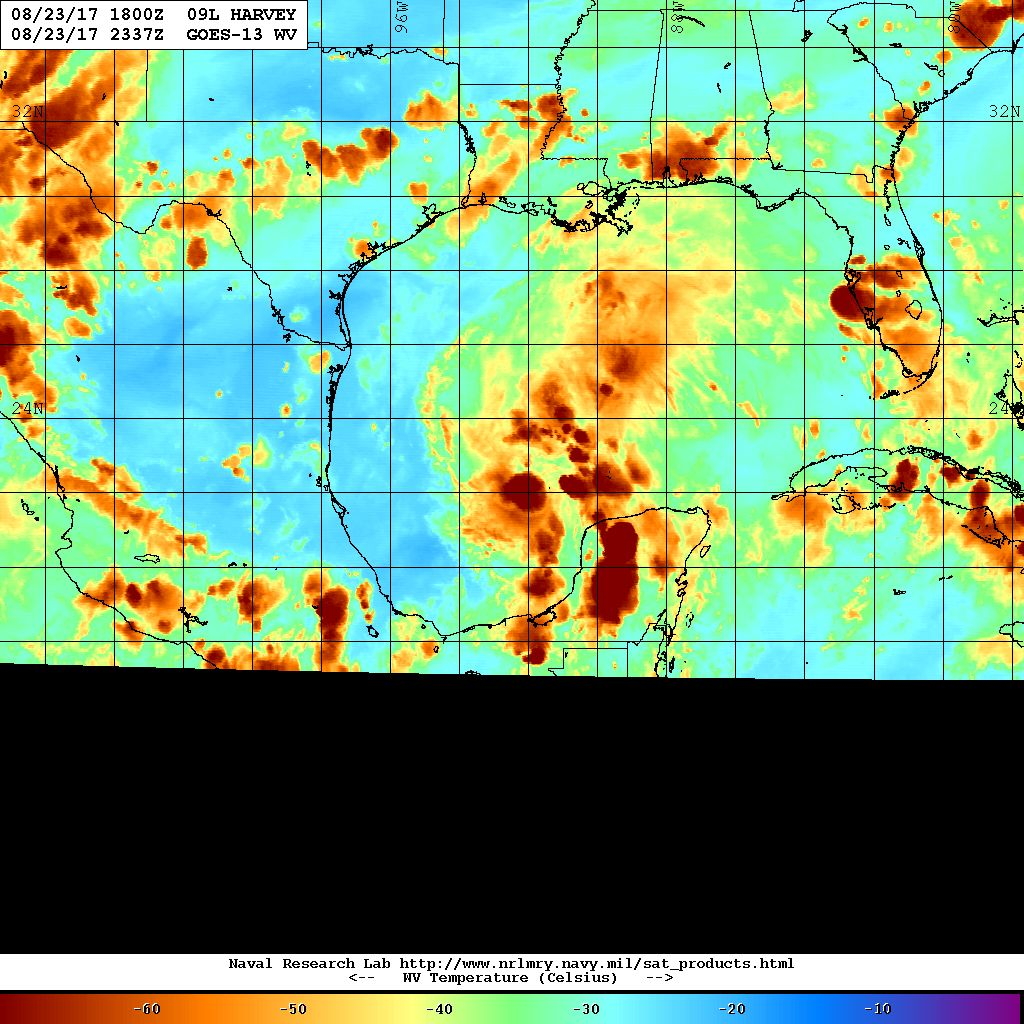
valid 00 UTC August 24. Image courtesy tropicaltidbits.com. (b) GOES-13 water vapor brightness temperature (shaded, deg C) valid 2337 UTC August 23. Image courtesy https://www.nrlmry.navy.mil/tc-bin/. | |
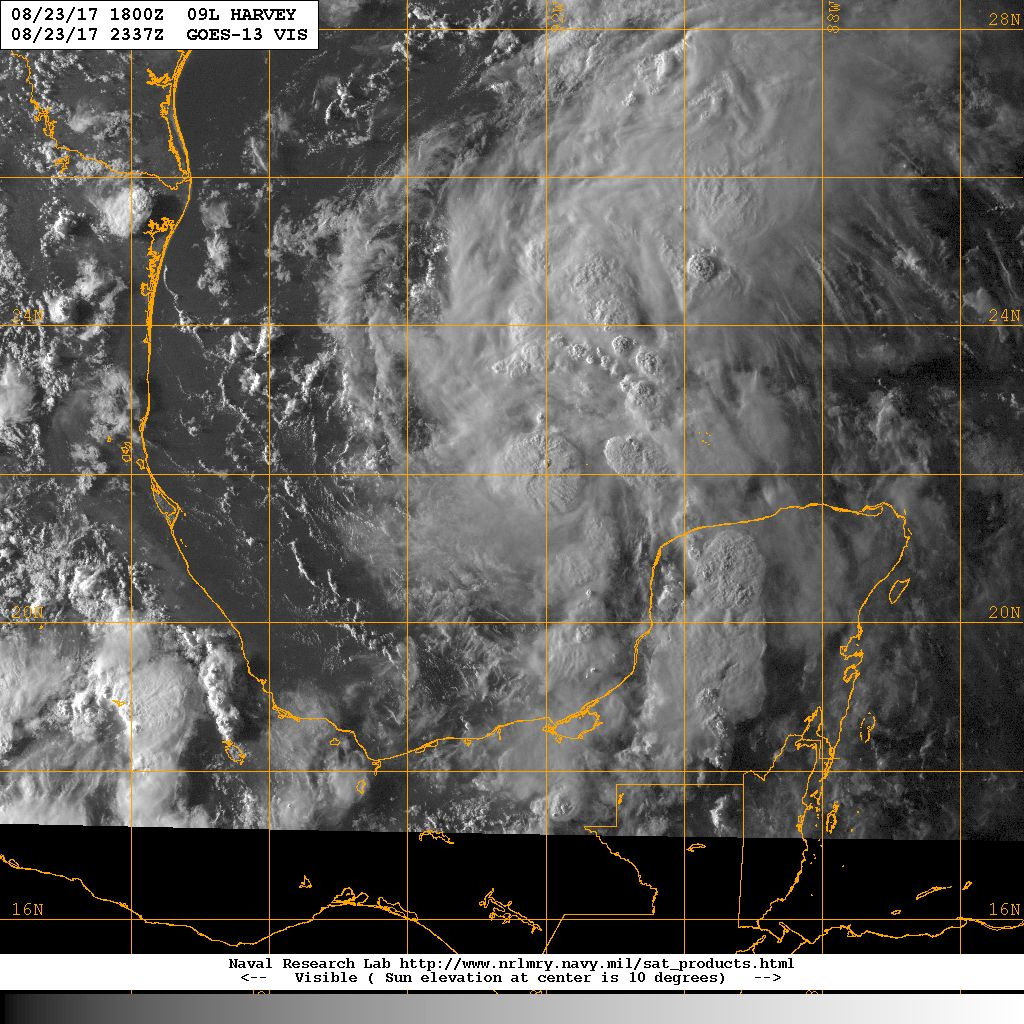
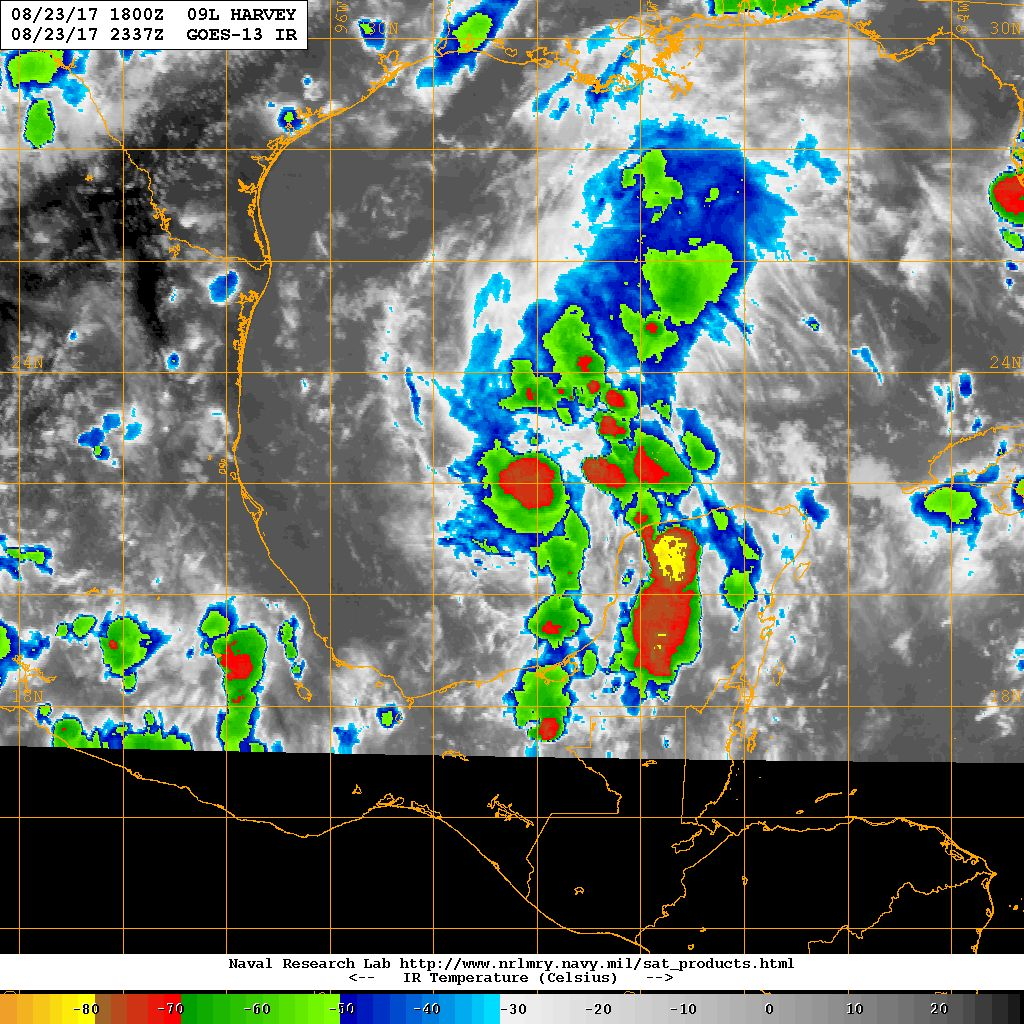
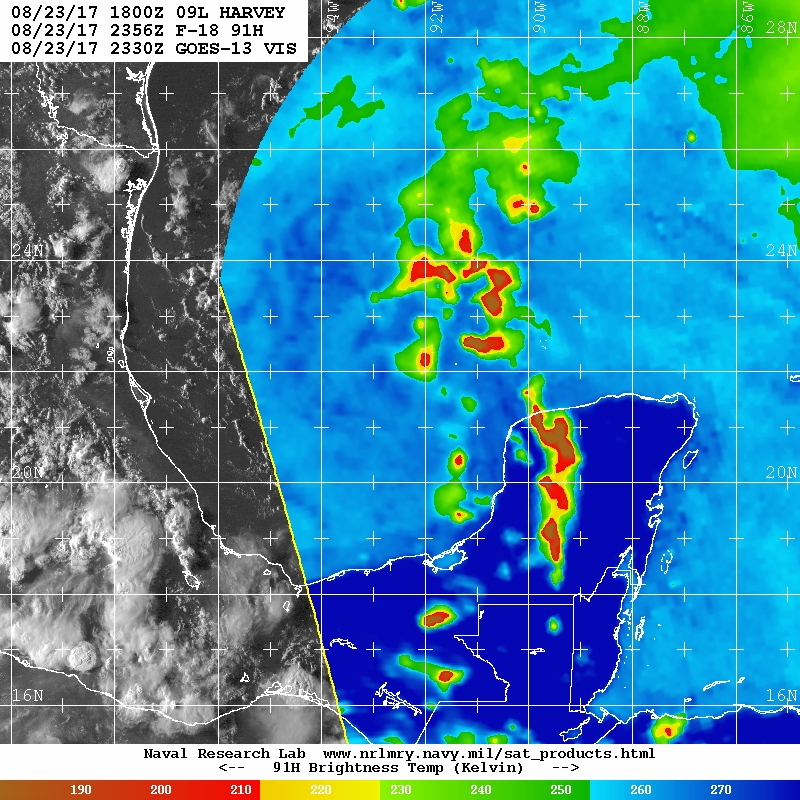
Localized areas of deep convection are developing in the broad circulation (Fig. 4). This convection is located on the east side of the circulation (i.e., downshear), arranged in a generally linear fashion. The coldest cloud tops and most significant ice scattering are over the Yucatan peninsula, though there are isolated areas closer to the circulation center over water as well.
(a) |
(b) |
(c) |
|
Figure 4. (a) GOES-13 visible satellite image valid 2337 UTC August 23
(b) GOES-13 infrared brightness temperature (shaded, deg C) valid 2337 UTC August 23 (c) 91H GHz F-18 microwave brightness temperature (shaded, K) valid 2356 UTC August 23. Images courtesy https://www.nrlmry.navy.mil/tc-bin/ | ||
 (a) |
 (b) |
|
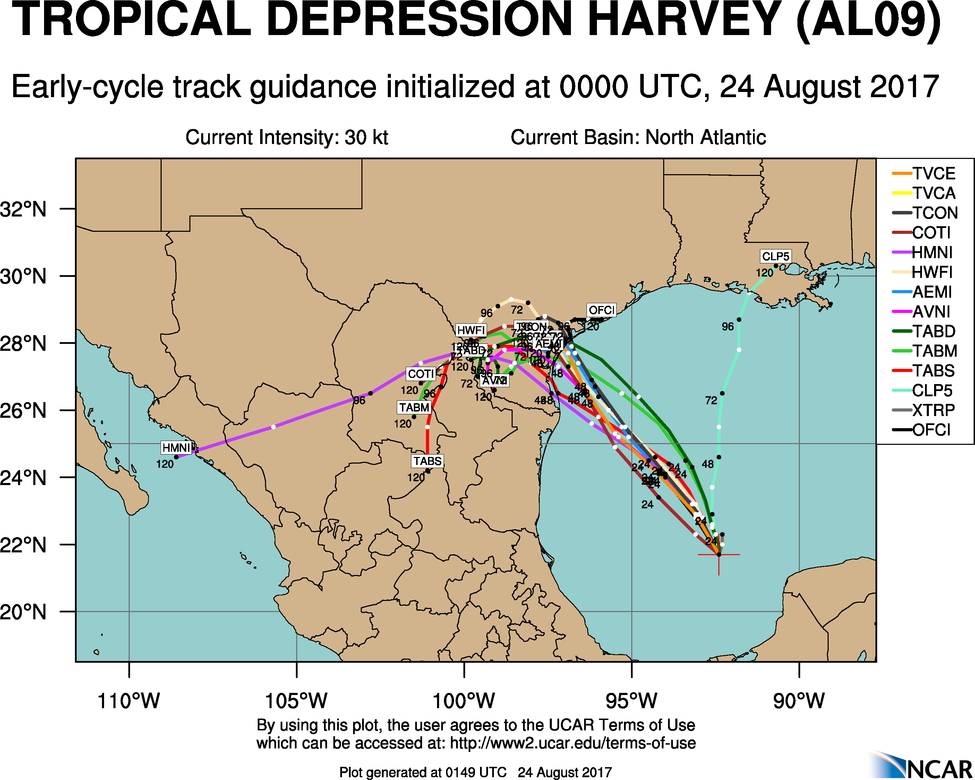
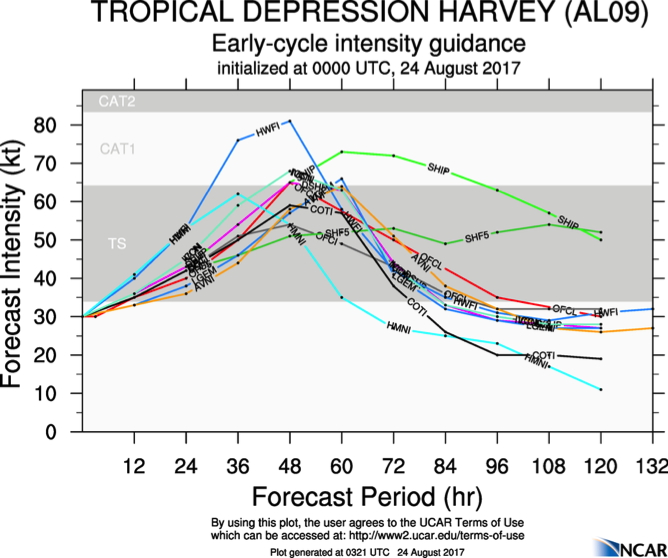
Figure 5. (a) Track forecast guidance for Tropical Depression Harvey valid 00
UTC August 24
(b) Intensity forecast guidance for Tropical Depression Harvey valid 00 UTC August 24. Images courtesy http://www.ral.ucar.edu/guidance/realtime/current/. | |
Forecast guidance is in good agreement that Harvey will track toward the northwest, making landfall in south Texas in the next 48-72 h (Fig. 5). Intensity guidance strengthens Harvey during this time, with HWRF being the most aggressive in bringing Harvey to a strong Category 1 hurricane in 36 h. The NHC official forecast just brings Harvey to hurricane strength prior to landfall. Any intensification in the next 12-24 h is likely to be slow until an inner core becomes better established.
|
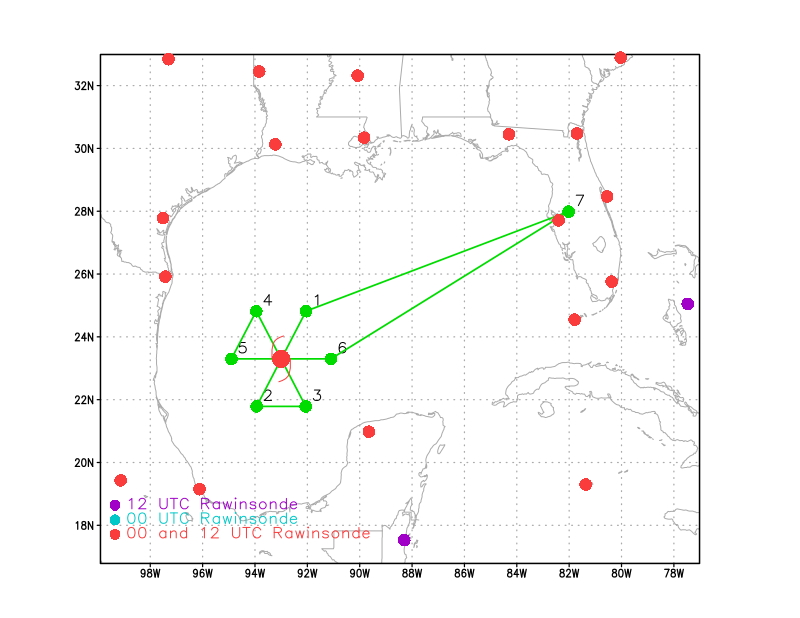
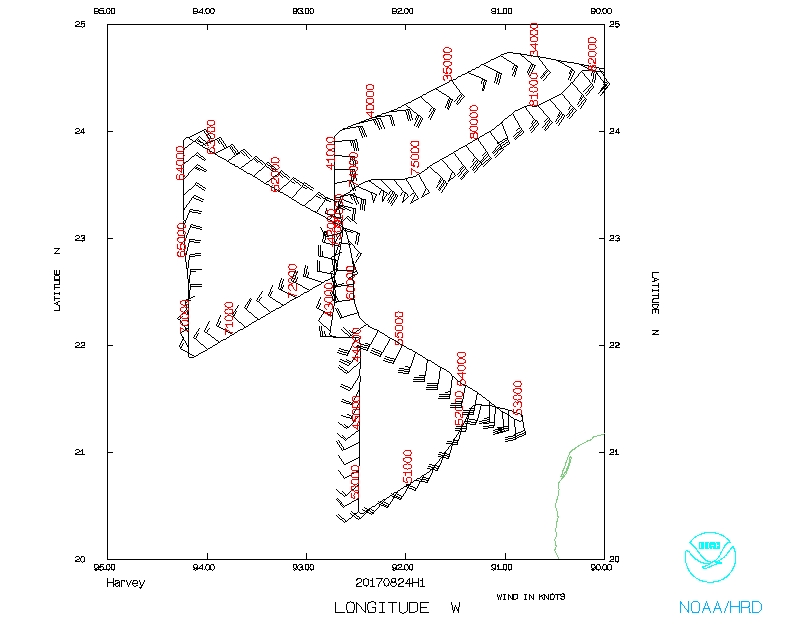
| Figure 6. Proposed flight track for mission 20170824H1 |
The mission plan called for a butterfly pattern (Fig. 6), with 105 nm legs. The original plan as shown in Fig. 6 had an IP on the northeast side. However, an attempt was going to be made to coordinate the final outbound leg with an overpass from CYGNSS. This required the outbound leg to be toward the northeast , meaning the IP would come in from the north. Combination GPS sonde/AXBTs are planned at all turn points, plus a center drop for NHC if a center can be found at the flight altitude of 7000 ft. If time and opportunity allows, perform an SFMR bank maneuver, likely on the north or northeast side. The G-IV and Global Hawk were also conducting missions in the Gulf of Mexico during this flight.
Mission Summary :
| Take off | Landing
| Linder-Lakeland Airport, FL
| 01:52 UTC
| Linder-Lakeland Airport, FL
| 09:56 UTC
| | ||
|
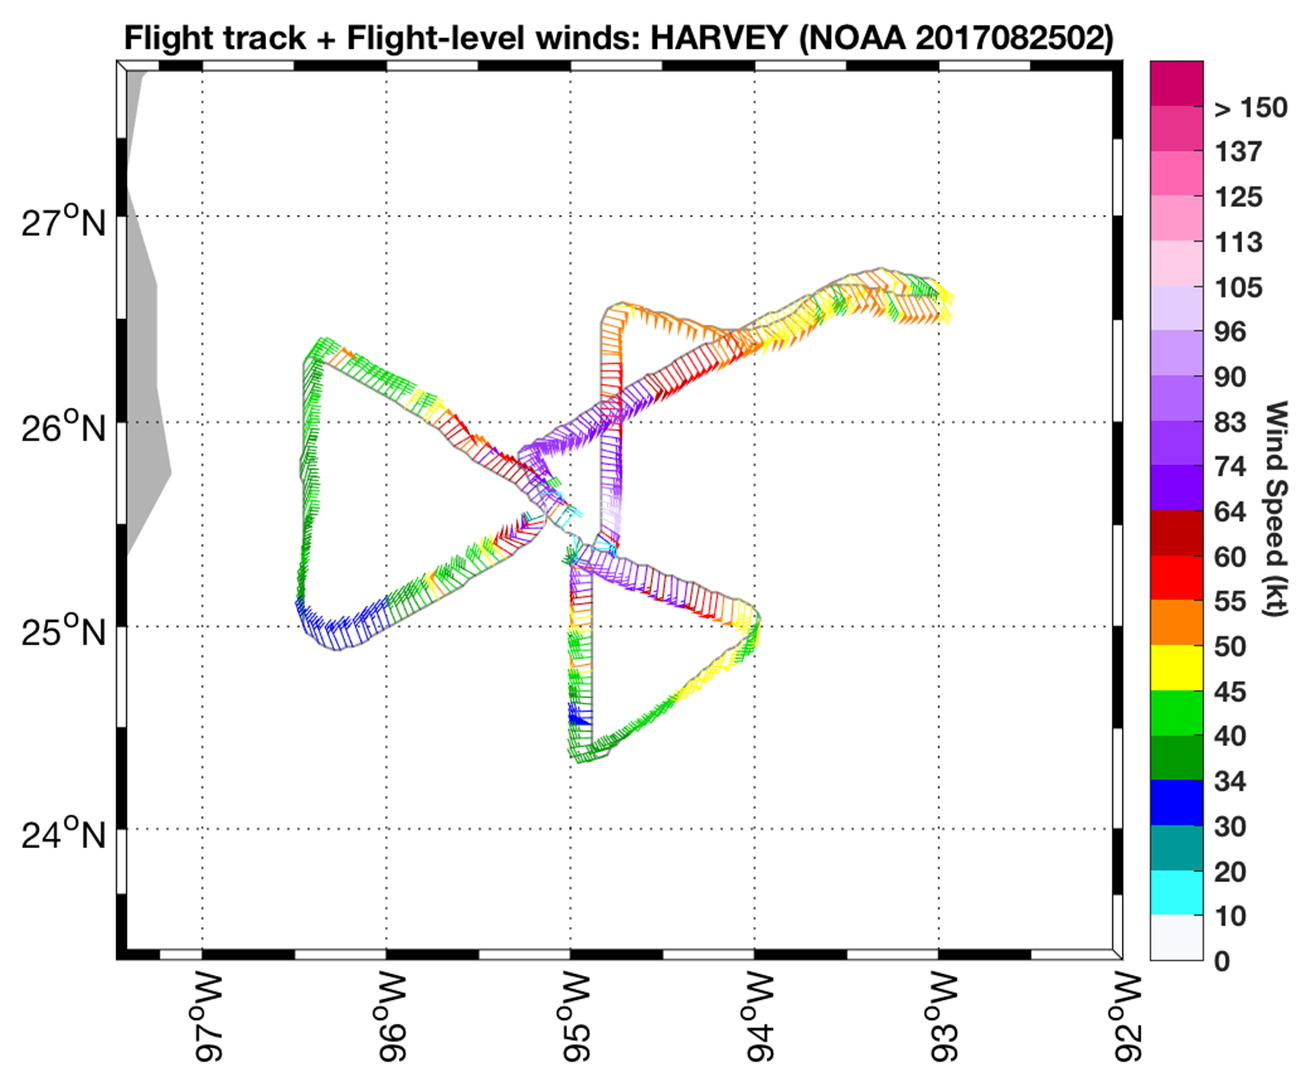
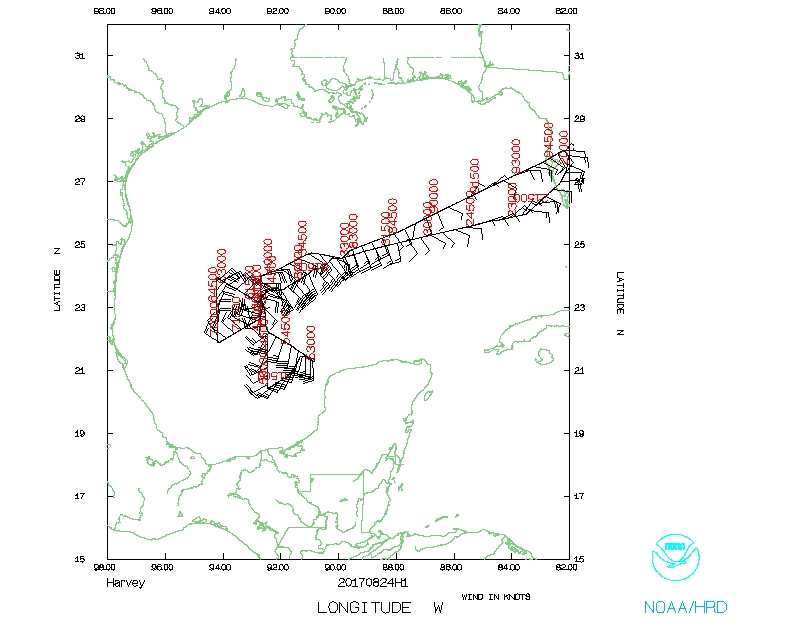
| Figure 7. Actual flight track for mission 20170824H1. Flight-level winds (barbs, kt) and wind speeds (shaded, kt) indicated. |
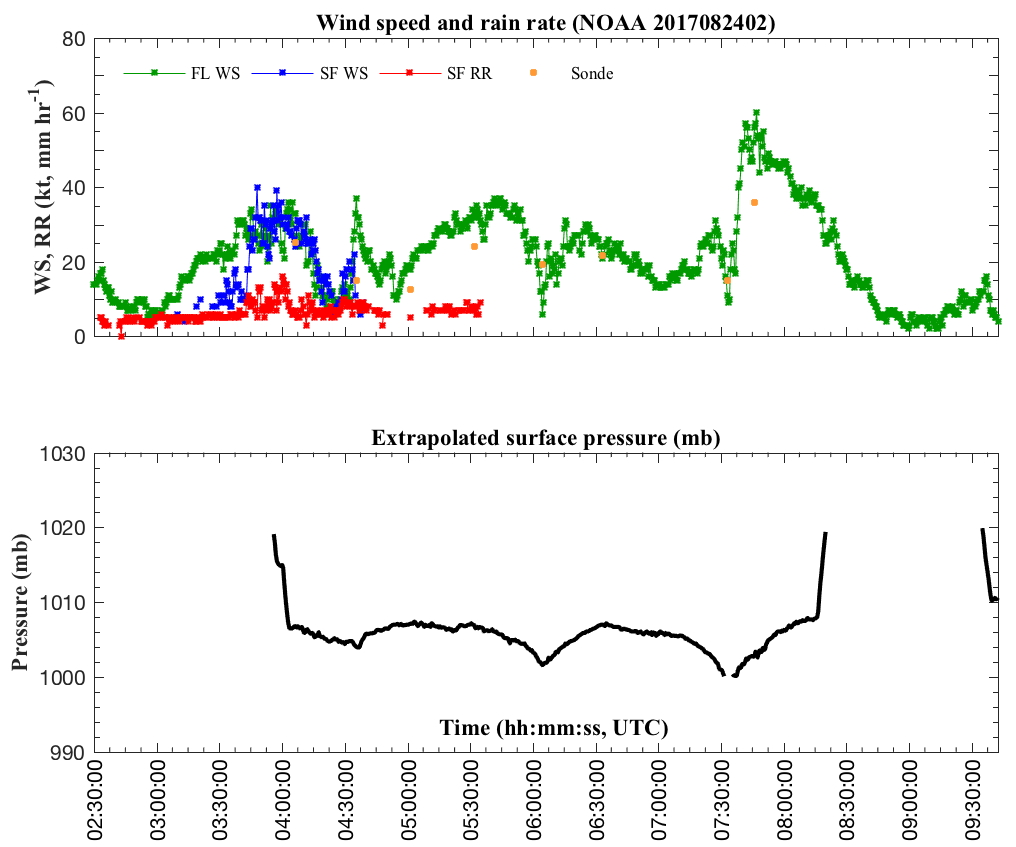
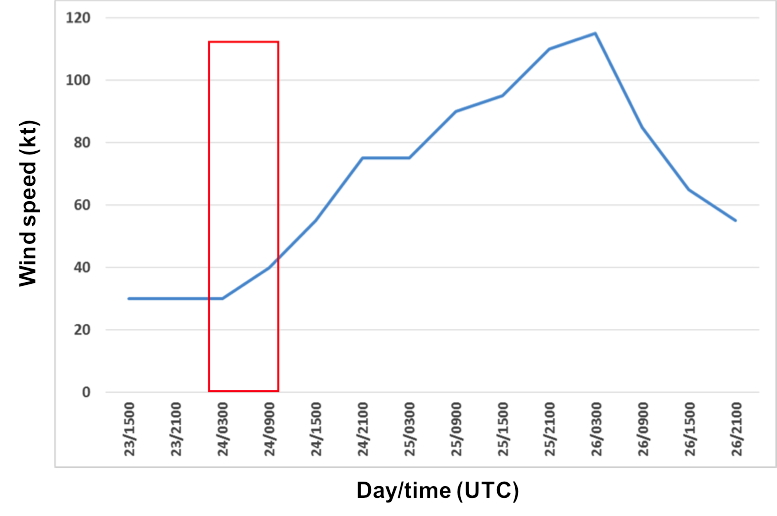
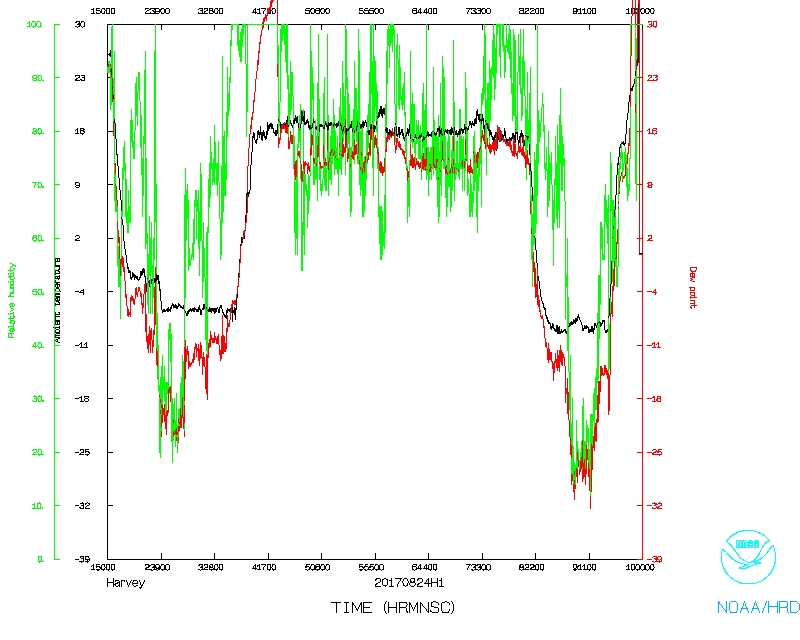
The actual flight track is shown in Fig. 7. Takeoff was at 0152 UTC from Lakeland, FL. The mission accomplished the intended flight pattern. Flight-level winds showed an asymmetric storm, with peak flight-level winds of ~ 65-70 kt on the northeast side. On the southwest side the strongest winds reached around 50 kt. Relatively strong winds extended a large distance to the northeast of the center, with >50 kt winds extending to the end of the extended outbound leg to the northeast, i.e., ~130 nm from the center. Time series of flight-level wind speeds showed this asymmetric structure at flight level (Fig. 8). On the final pass, winds were ~30 kt on the southwest side, but were ~65 kt on the northeast side. SFMR winds were limited to the first 1-2 h of the mission, as the SFMR failed during the flight. Extrapolated sea level pressure showed the MSLP decreasing from pass to pass, from ~1004 hPa during the first pass to ~1000 hPa during the third pass. A plot of the time of the mission overlain on the NHC working best track (Fig. 8c) shows that this mission occurred during the onset of a period of rapid intensification.
 (a) (b) |
 (c) |
|
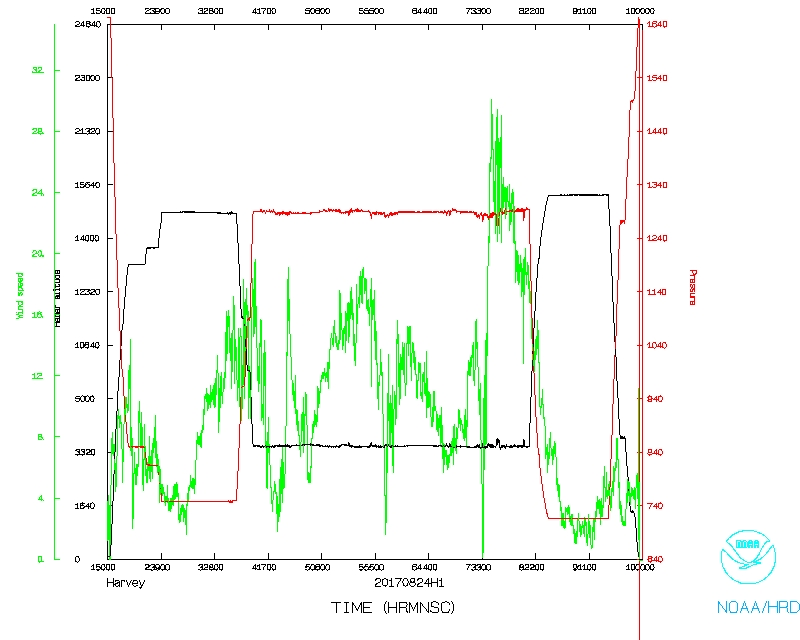
Figure 8. (a) Time series of flight-level winds (green, kt), SFMR winds (blue,
kt), and SFMR rain rate (red, mm/hr) for mission 20170824H1
(b) Time series of surface pressure extrapolated from flight level (mb) for mission 20170824H1 (c) time series of NHC working best track intensity of Harvey. Red box denotes times of mission 20170824H1. | |
 (a) |
 (b) |
 (c) |
|
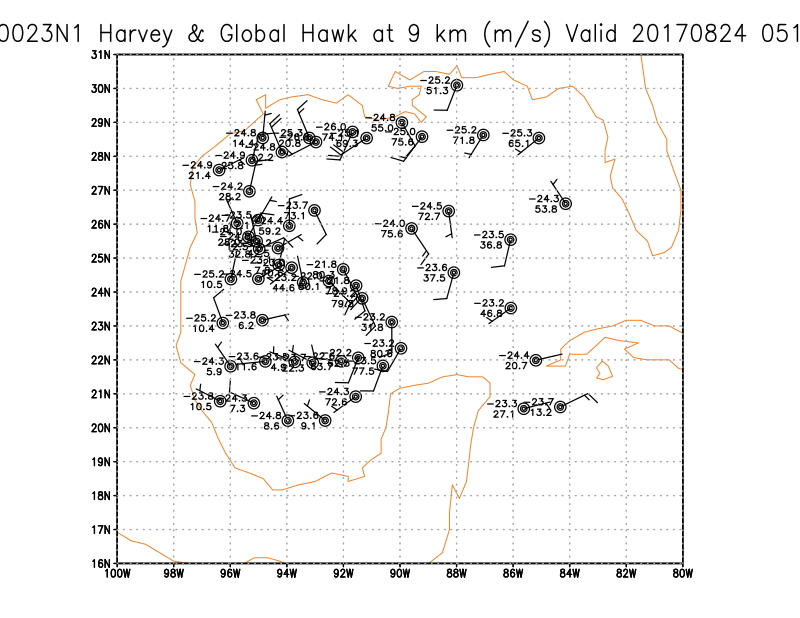
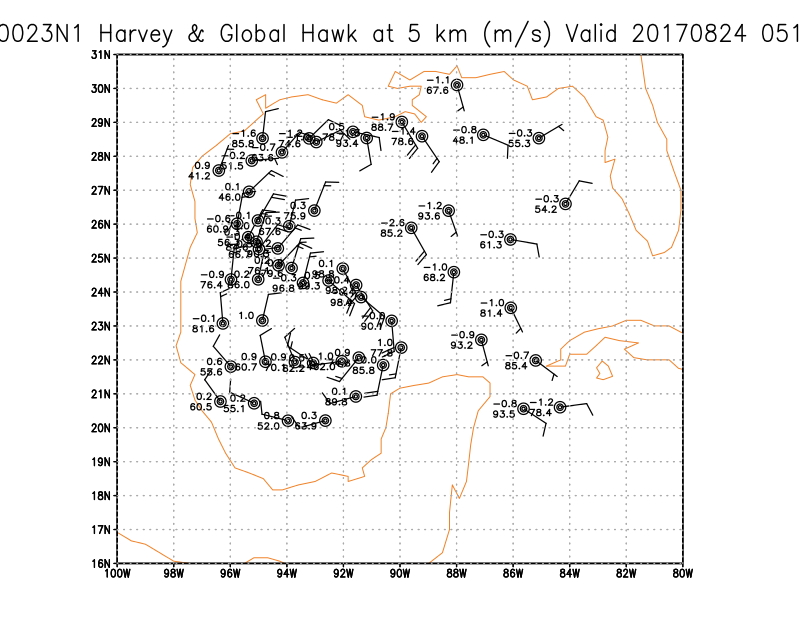
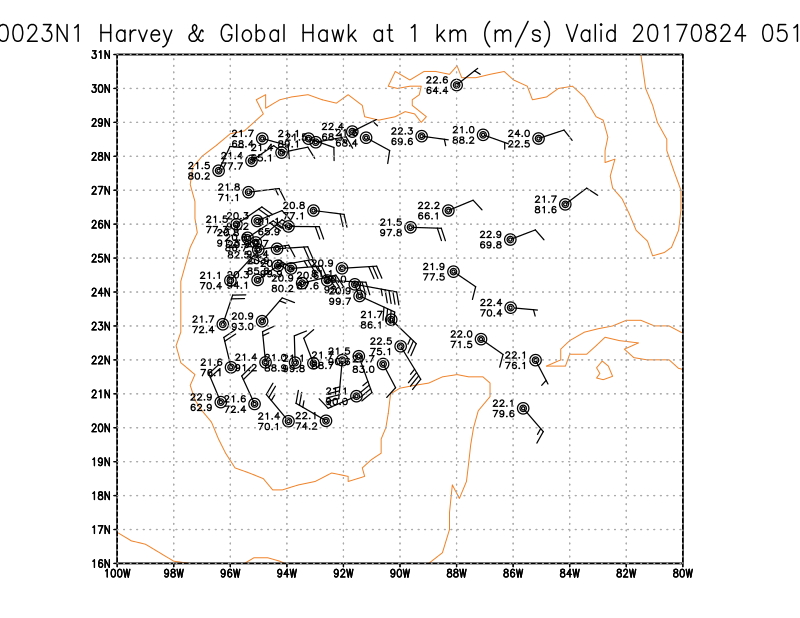
Figure 9. Station model plots of winds (barb, m/s), temperature (deg C), and
relative humidity (%) from GPS dropsondes from the G-IV and Global Hawk aircraft during August 24-25 at (a) 9 km; (b) 5 km; and (c) 1 km altitude. | ||
Synoptic maps from the G-IV and Global Hawk (Fig. 9) show clearly the upper-level low as reflected in the cyclonic circulation in the western Bay of Campeche at 9 km altitude. At 5 and 1 km altitude a cyclonic circulation is also apparent, but it is not certain to what extent this circulation reflects a downward penetration of the upper-level low or the circulation of Harvey itself. The circulation at 1 km, located to the northeast of that seen at 9 km, is likely the Harvey circulation. The relative humidity (RH) is very dry at 9 km in the extreme southwest Bay of Campeche, with some values of RH at or less than 10%. At the lower altitudes the drying, while still apparent, is not nearly as pronounced as at 9 km. This pattern is generally consistent with the RH analysis shown in Fig. 3a.
 |
|
Figure 10. Winds (barb, m/s) and relative humidity (colored dots, %) at 500 hPa from Global Hawk dropsondes during August 24-25. Shear-relative quadrants noted in lower-left corner. |
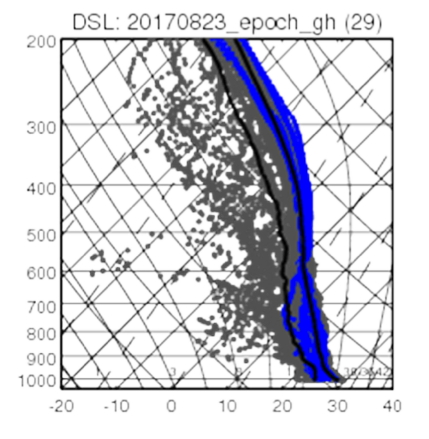
Examining these fields in a shear-relative framework (Fig. 10), it is clear that the moist mid-tropospheric air is primarily located on the downshear side. Upshear, RH at 500 hPa is ~50% in most locations. This drying at and above 500 hPa is also clear in shear-relative quadrant averages shown in Fig. 11. Maximum drying is seen between ~300 and 400 hPa in the upshear right quadrant.
While not shown, satellite imagery and aircraft fixes from the NOAA P-3 and AF C-130 showed that the center appeared to shift to the north during the mission, within the precipitation shield seen in the northeast area of the circulation. atellite imagery also showed an expanding cold cloud shield appearing over the center, including on the upshear side of the storm. Deep convection was embedded in stratiform precipitation on the northeast side. The pressure at splash of the dropsonde released during the final pass was ~995 hPa, indicating that the storm was strengthening (cf. Fig. 8c).
The aircraft landed at 0956 UTC.
 (a) |
 (b) |
 (c) |
|
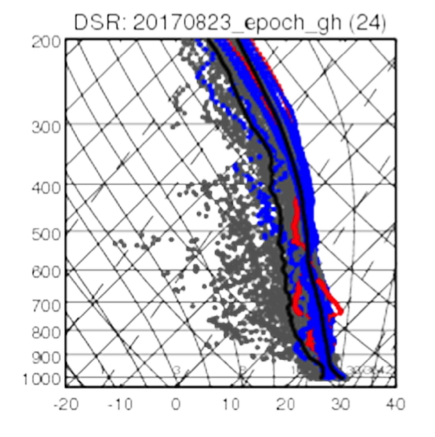
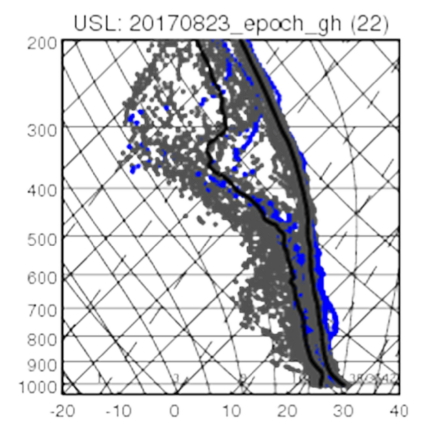
Figure 11. (a) Temperature and dewpoint profiles averaged in downshear left
(DSL) quadrant for Global Hawk drops. Grey profiles denote outer environment
(> 200 km radius); blue profiles denote near environment (50-200 km); red profiles denote inner core (< 50 km). (b) As in (a), but for DSR quadrant; (c) As in (a), but for USL quadrant; (d) As in (a), but for USR quadrant. | ||
Mission Evaluation:
There were two major failures during this mission. First, the SFMR failed a few hours into the mission, and in fact may have been faulty throughout. Many attempts were made to repair the SFMR in-flight, but they were unsuccessful. Second, and more serious, the aft antenna on the tail Doppler radar was not producing any velocity data. Because of this, no winds were obtained during the mission, and no radar analyses were transmitted to EMC. Unfortunately, this problem was not discovered until well into the third and final pass, so this data is lost forever. A series of steps has now been implemented to prevent this from occurring in the future, including a detailed, and repeated, check of velocity and reflectivity fields from both fore and aft antennas throughout the mission.
Ten dropsondes (6 HFIP, 3 NHC, 1 Ocean Winds) were released, as were six AXBTs. The final southwest-northeast pass was well-coordinated with CYGNSS, and the final dropsonde in the outbound leg was dropped in a region of high winds, which was helpful to NHC in diagnosing the intensity of the storm. Of the 6 AXBTs, only 3 of them worked. One sonde failed. Because of the SFMR failure, the SFMR bank maneuver was not attempted.
Problems :
Major problems with the TDR and SFMR, plus 3 AXBTs and 1 dropsonde failed.
Rob Rogers
August 30, 2017
 Flight track |
 Temperature and Moisture |
 Wind and Atlitude |
 Flight track detail |
LPS log |
Radar log |
Drop log |
AXBT log
Flight Director's manifest |
Flight Director's log |
NetCDF data |
1 second data |
SFMR data |
serial data
Radar jobfile Leg #1 24:28:31 Z | Radar jobfile Leg #2 25:08:00 Z | Radar jobfile Leg #3 26:04:00 Z -->