Mission Summary
20180910H1 Aircraft 42RF [WC06A]
Hurricane Florence (AL06)
Mature Stage Experiment / Ocean Winds
Aircraft Crew (42RF)
| Aircraft Commander | Justin Kibby
|
| Co-pilot | Adam Abitol
|
| Co-pilot | John Rossi
|
| Navigator | Brian Richards
|
| Flight Engineer | Paul Darby
|
| Flight Director | Mike Holmes
|
| System Engineer | Joe Greene
|
| Data Technician | Mike Mascaro
|
| AVAPS Operator | Nick Underwood
|
Scientific Crew (42RF)
| Jon Zawislak | Observer | HRD
|
| Heather Holbach | Observer | HRD
|
| Paul Chang | Observer | NESDIS
|
| Zorana Jelnak | Observer | NESDIS
|
| Joe Sapp | Observer | NESDIS
|
Scientific Crew (Ground)
| Radar | Joe Griffin | HRD
|
Mission Plan :
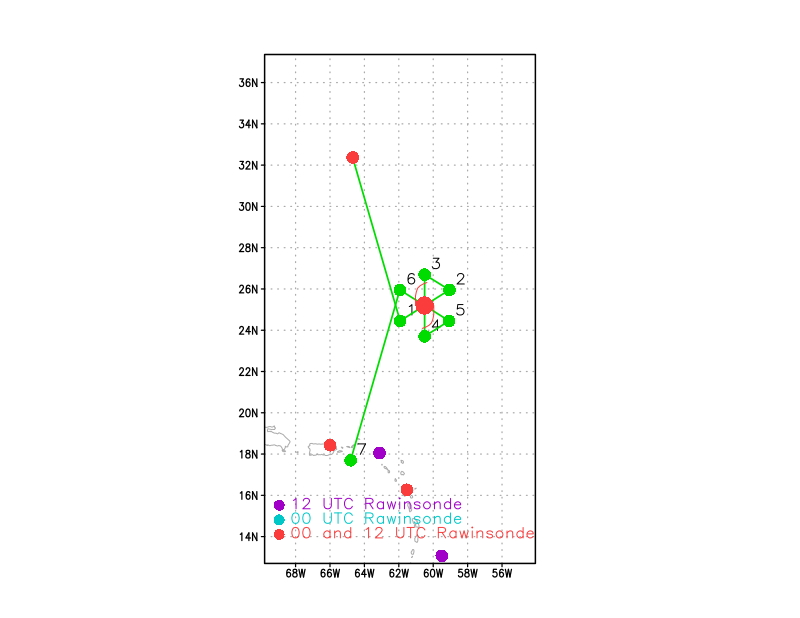
NOAA42 will conduct a research mission for the Mature Stage Experiment, as well
as for the Ocean Winds Experiment (NESDIS IWRAP instrument). The initial plan
calls for a butterfly pattern with 90 nmi legs (Fig. 1), which is oriented with
an IP to southwest of the storm. We'll start inbound on the 240°/outbound
60° azimuths, then inbound 360°/outbound 180° azimuths, and finally
inbound 120°/outbound 300° azimuths (similar pattern as yesterday's
flight).The first leg is timed and oriented for a CYGNSS underpass beginning
around 1400 UTC, although our late departure will make that underflight less
than ideal. There will be dropsondes at the endpoints, midpoints, and centers
in the butterfly, and at the radius of maximum wind (RMW) as dictated by our
objectives. AXBT combo drops with dropsondes are anticipated at the midpoints,
a couple of the endpoints, as well as at the start of the SFMR High Incidence
Angle module (part of the SFMR Experiment, Objective #1), and for IWRAP, if
flown later in the mission. Time permitting, following the completion of the
butterfly survey pattern, we'll proceed into repeated penetrations in high wind
and rain areas for Ocean Winds. Sondes would be required for that module. NHC
requested fixes and sondes for every center pass. The P-3 will recover in St.
Croix following the science portion of the mission.
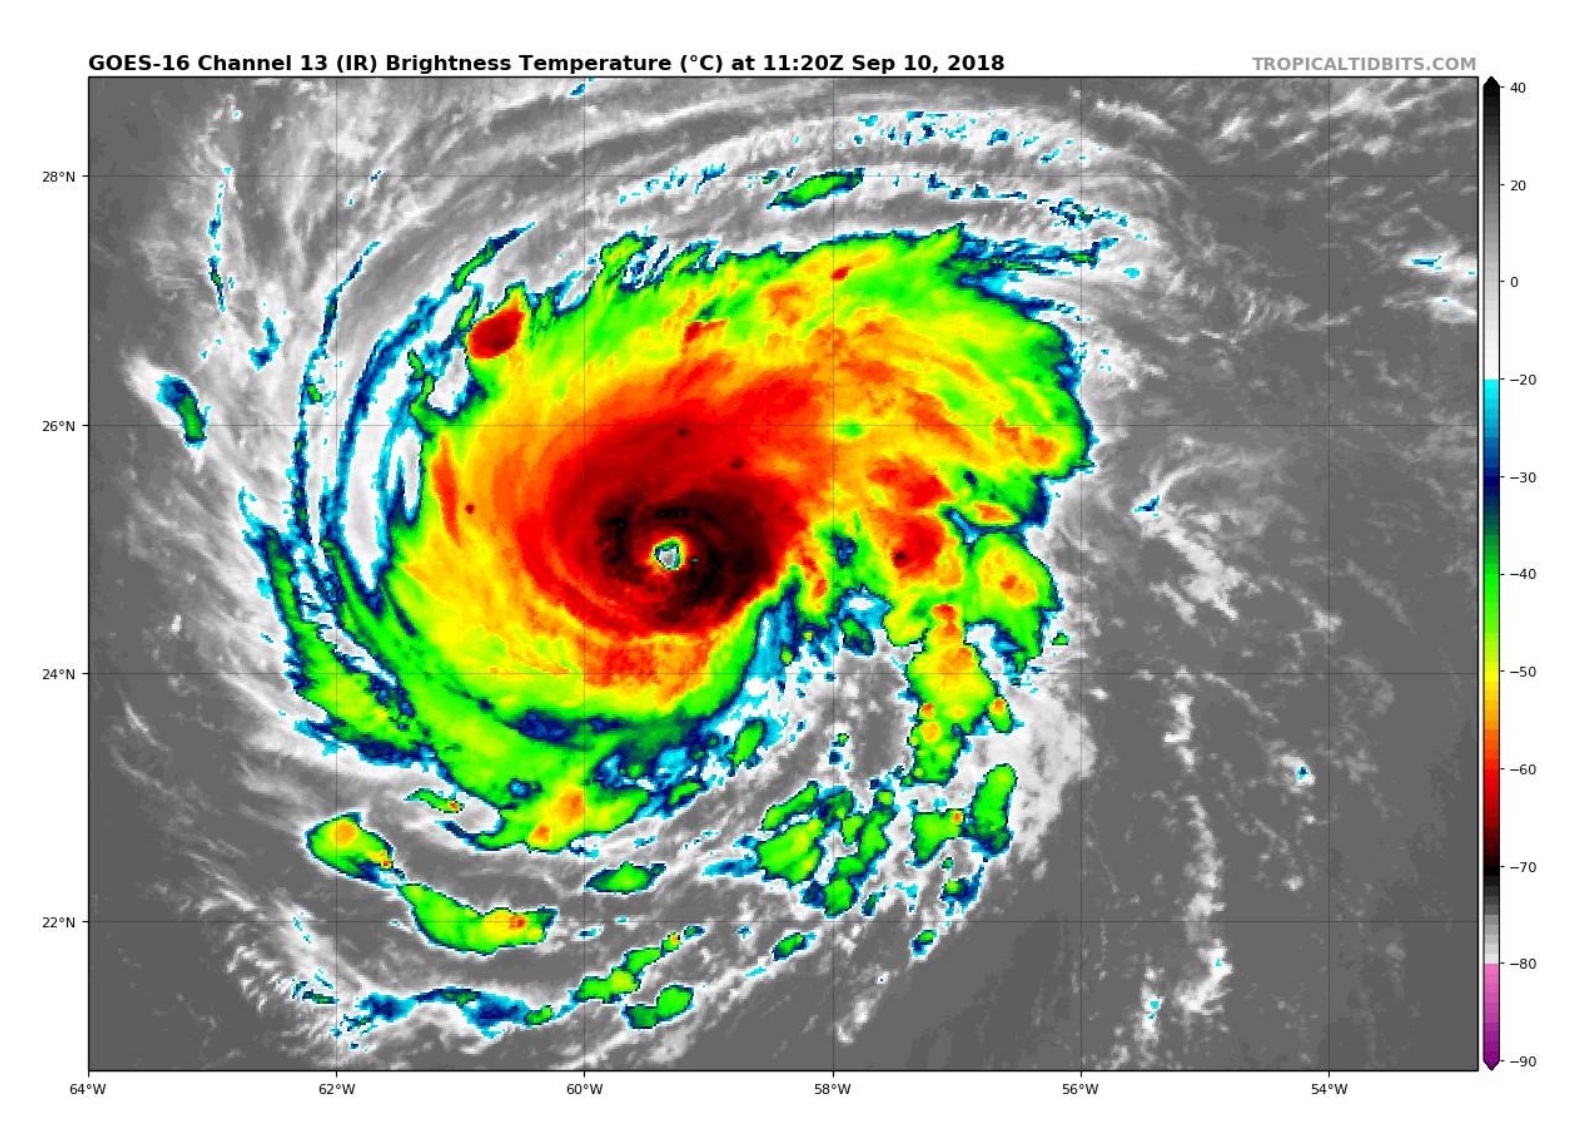
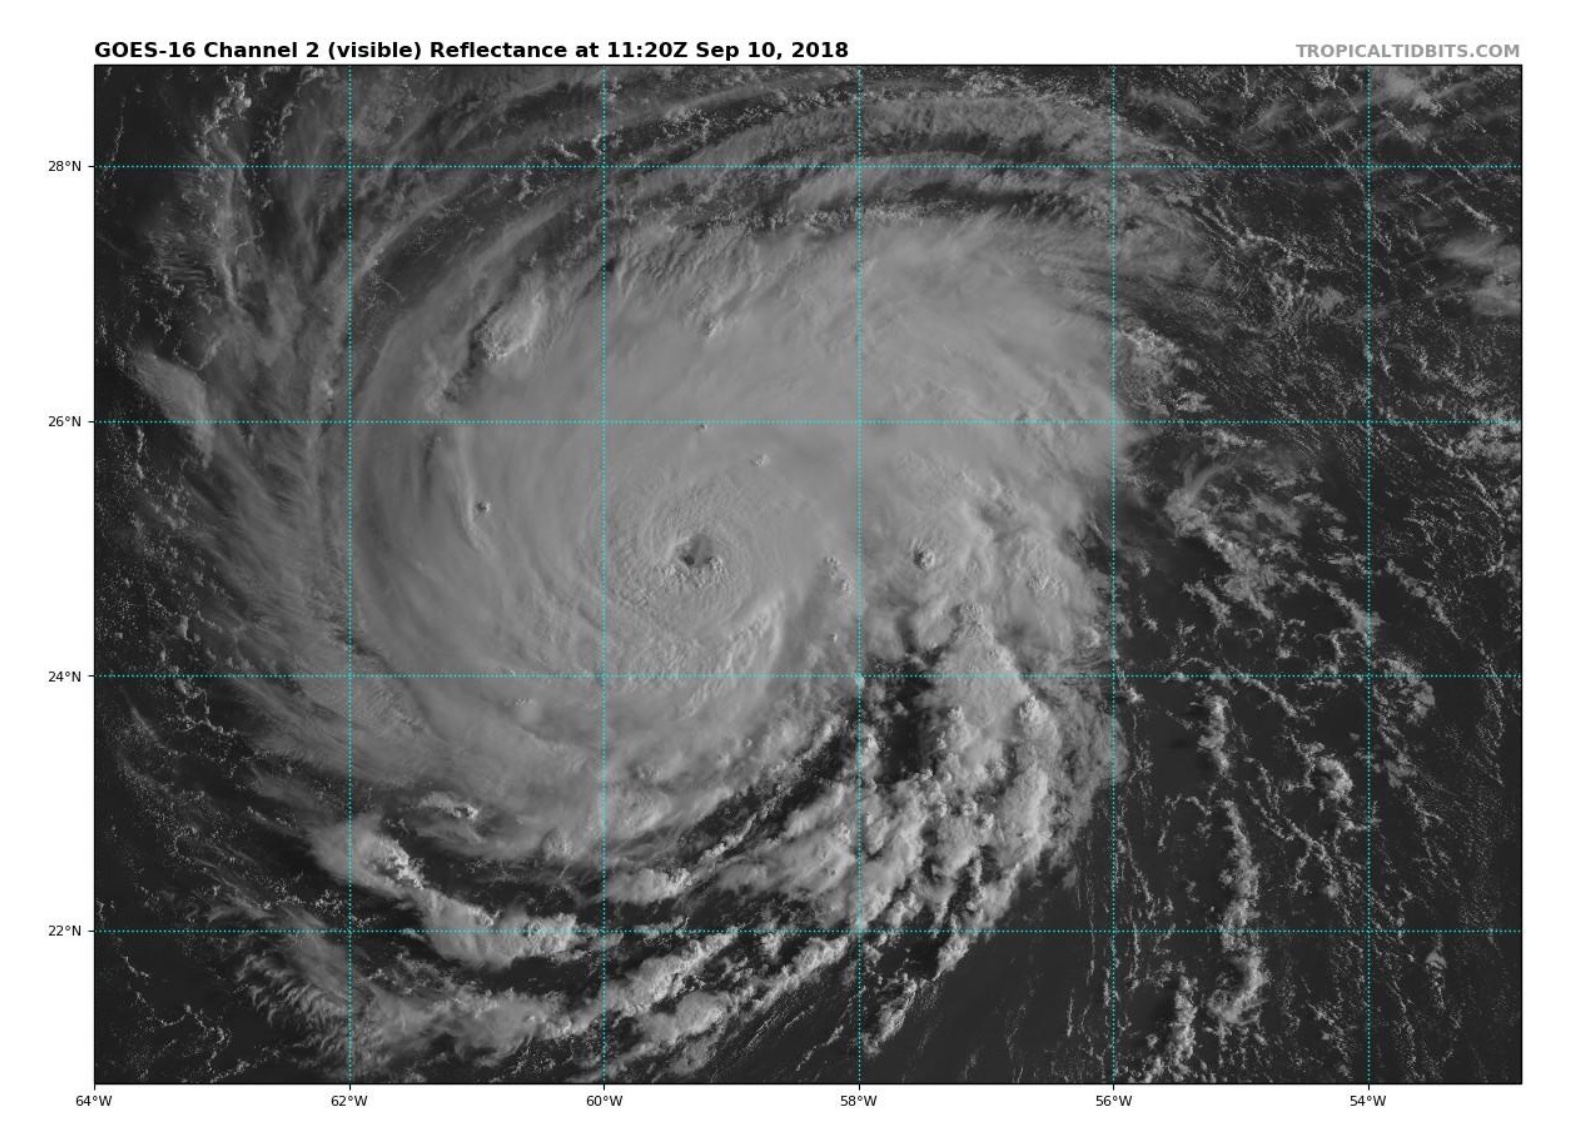
Hurricane Florence has continued its rapid intensification event that began
yesterday, and now has a small eye visible in satellite imagery (IR imagery,
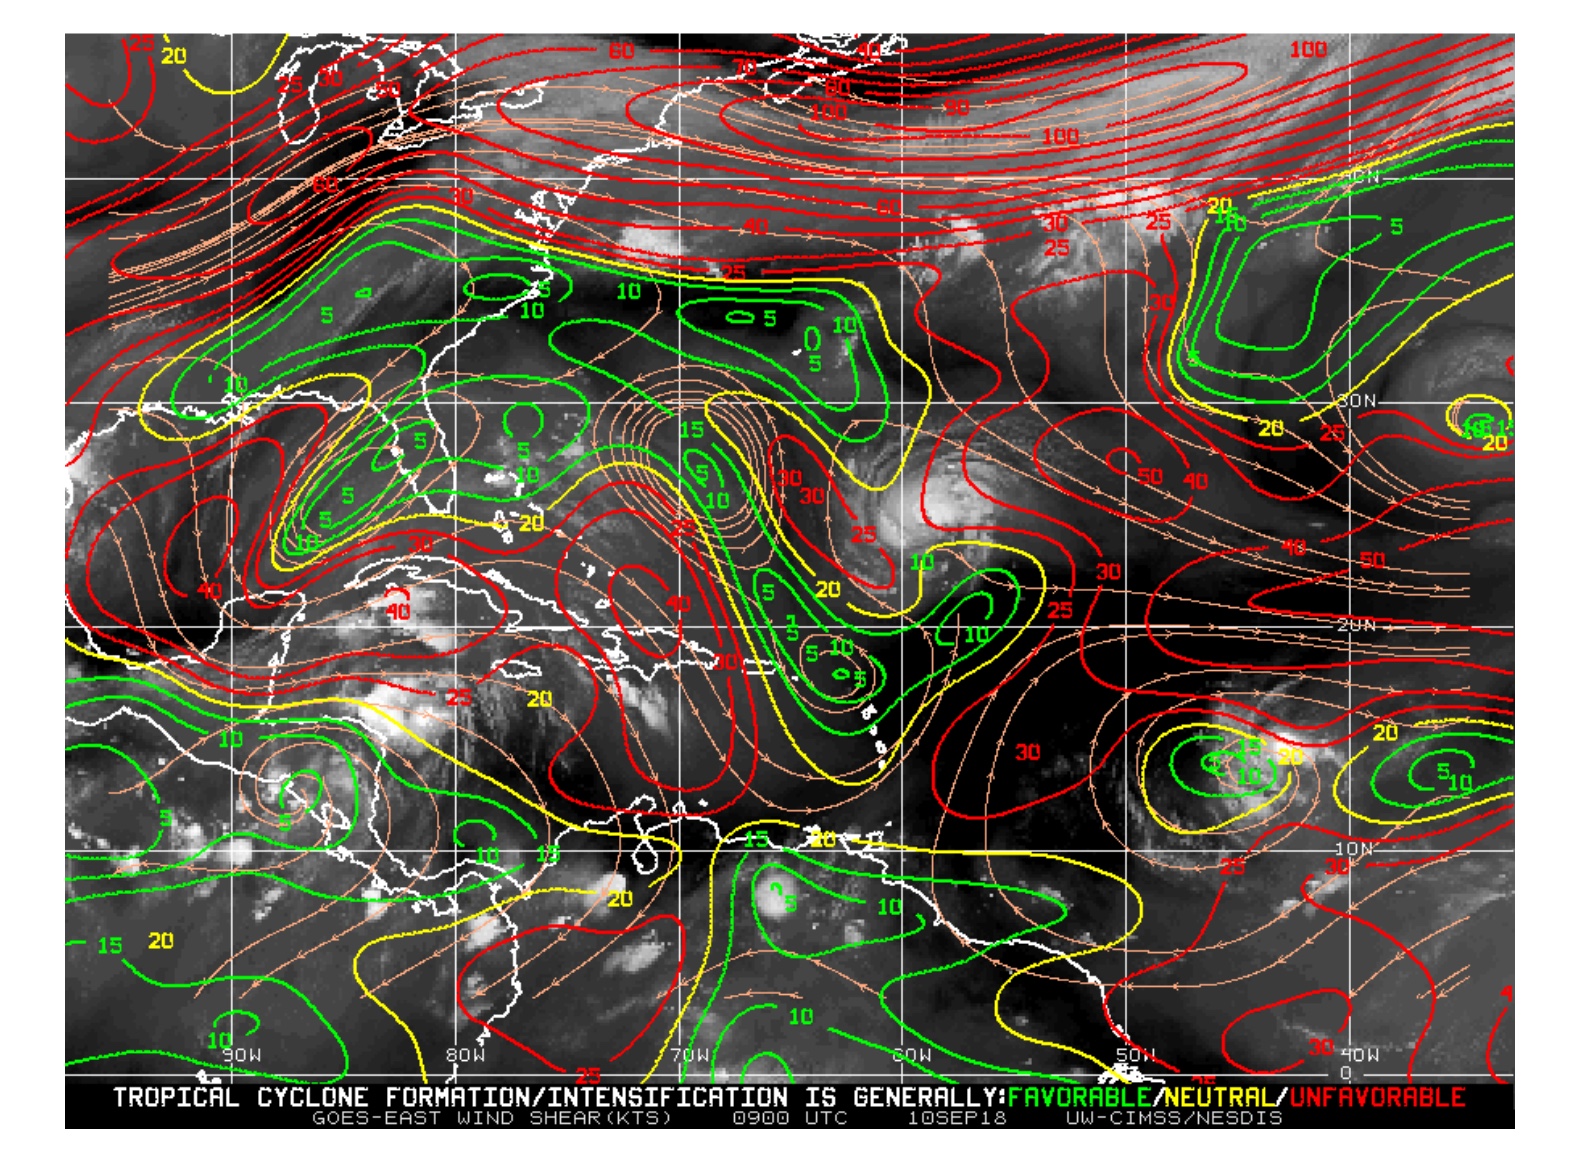
Fig. 2, visible imagery, Fig. 3). Overall, the environmental conditions appear
to be favorable for continued rapid intensification (shear low, Fig. 4, SSTs
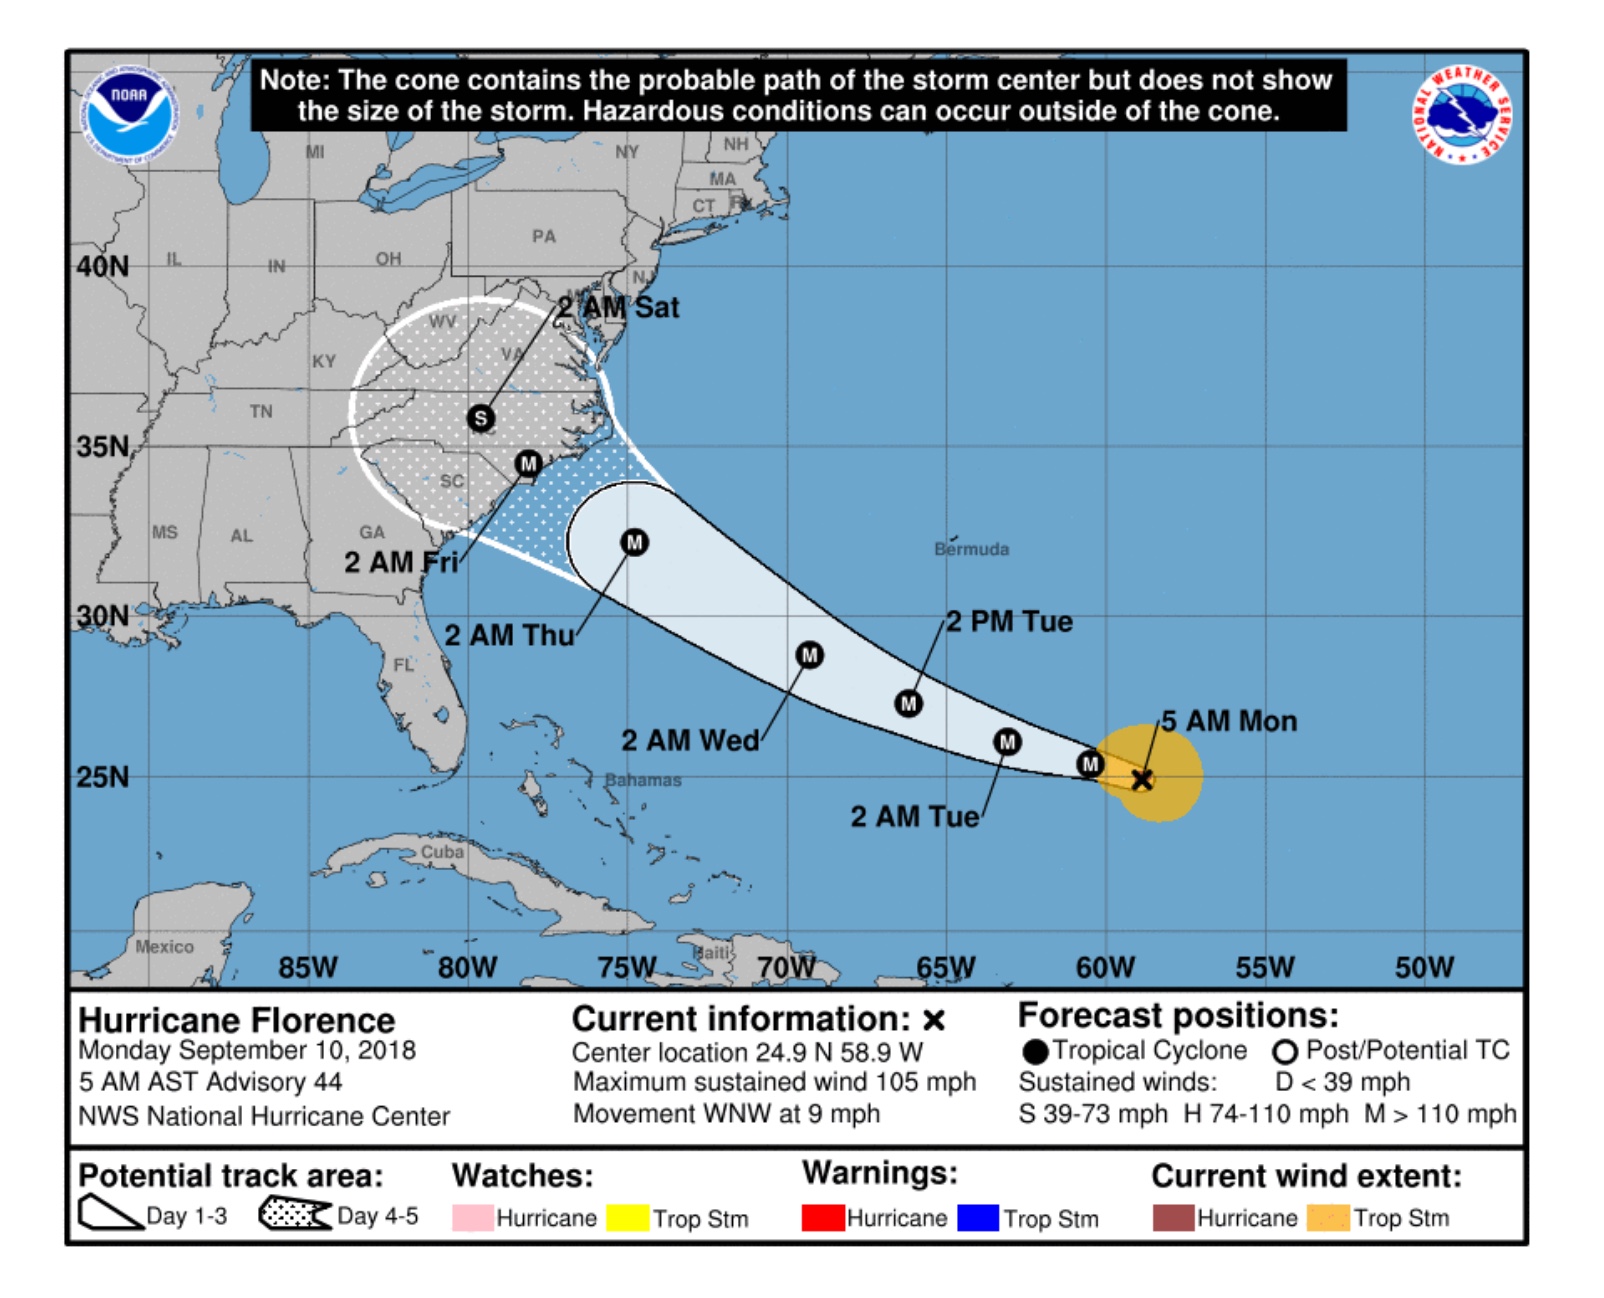
high), unless an eyewall replacement cycle occurs. As of the 5 AM NHC advisory,
Hurricane Florence is located at 24.9°N/58.9°W, MSLP of 969 hPa,
intensity of 90 kt, and moving west-northwest at 8 kt. The 1800 UTC SHIPS
(valid towards the end of the mission) is 119°/5 kt (1200 UTC SHIPS is
127°/4 kt. We expect the rapid intensification to conclude during the
mission, with a major hurricane heading westward towards the U.S. (Fig. 5).
MISSION PLAN: Florence
Prepared by the Hurricane Research Division
Aircraft: N42RF
Proposed takeoff: 10/1200Z
|
DROP LOCATION TABLE
|
| #
| LAT
| LON
| RAD/AZM
| Time
|
|
| deg min
| deg min
| nmi/deg
| hr:min
| | 1S | 24 27 | 61 55 | 90/240 | 1:32
| | 2S | 25 57 | 59 04 | 90/060 | 2:20
| | 3S | 26 42 | 60 30 | 90/360 | 2:44
| | 4S | 23 42 | 60 30 | 90/180 | 3:32
| | 5S | 24 27 | 59 05 | 90/120 | 3:56
| | 6S | 25 57 | 61 56 | 90/300 | 4:44
| |
Mission Summary :
| Take off
| Landing
| Bermuda
| 13:22 UTC
| St. Croix, USVI
| 22:42 UTC
| | Penetrations
| 9
| | Expendables
| 43 Dropsonde (12 HRD, 7 NWS, 24
NESDIS) /4 AXBTs (0 good SSTs)
| |
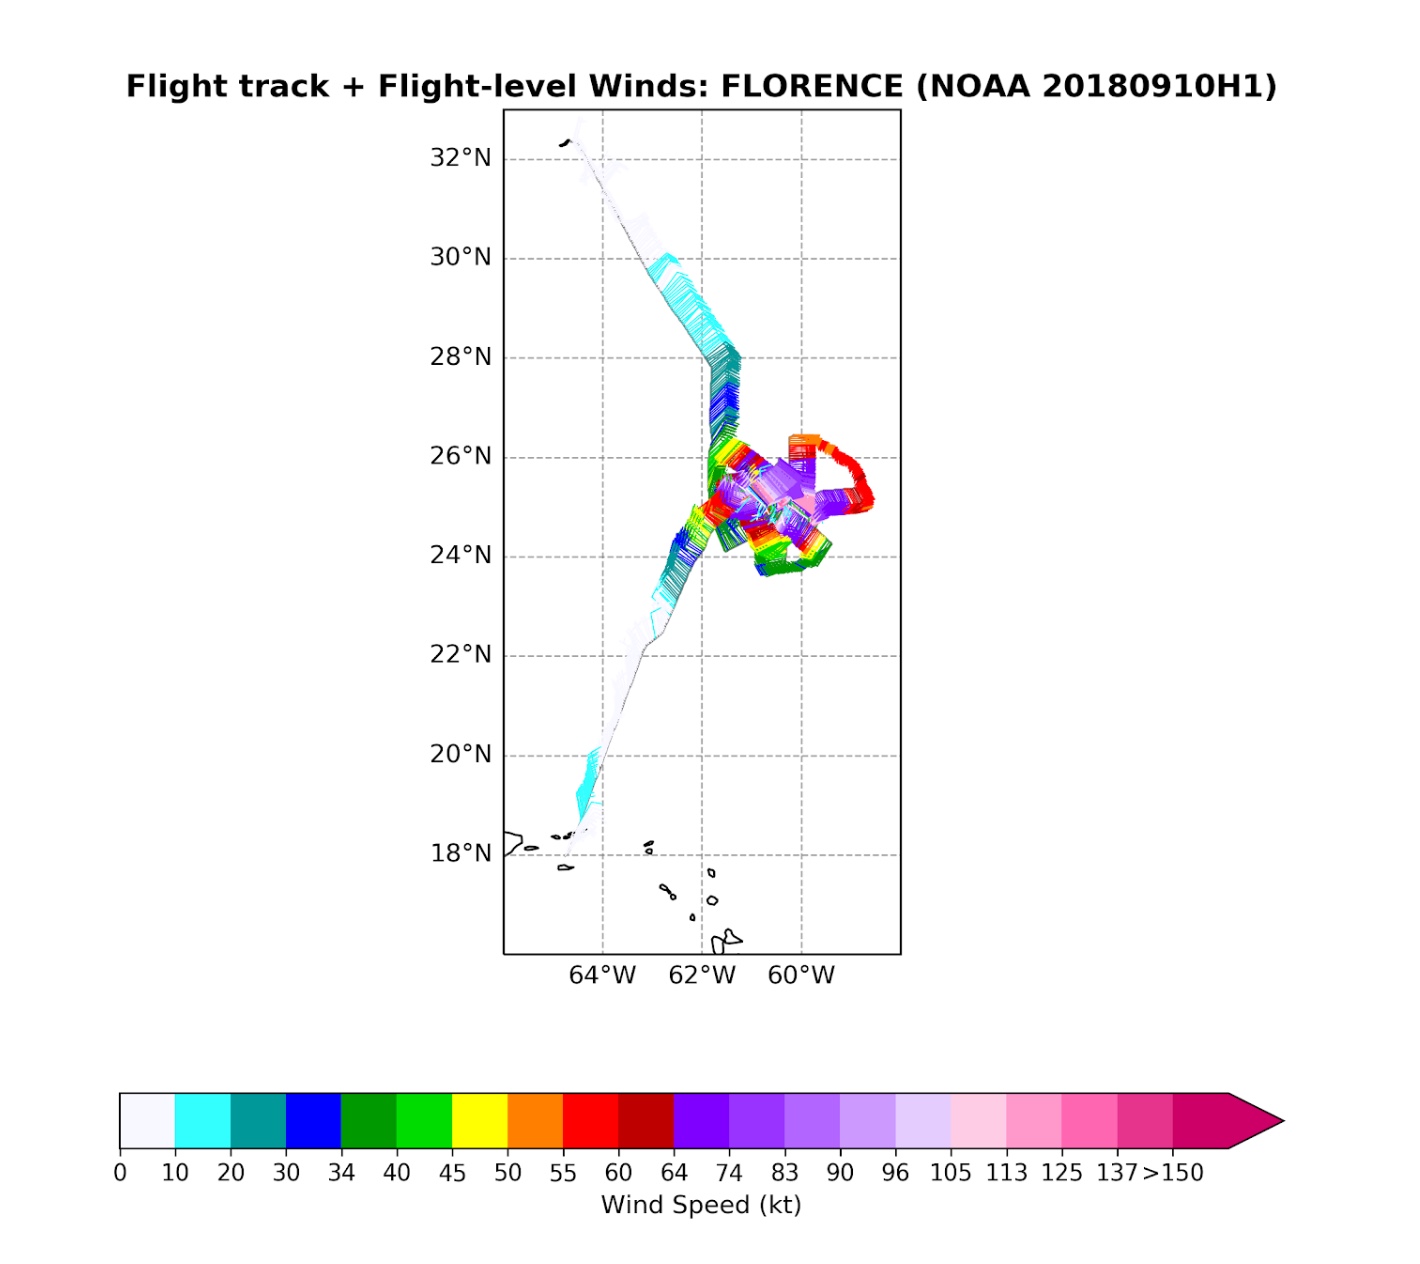
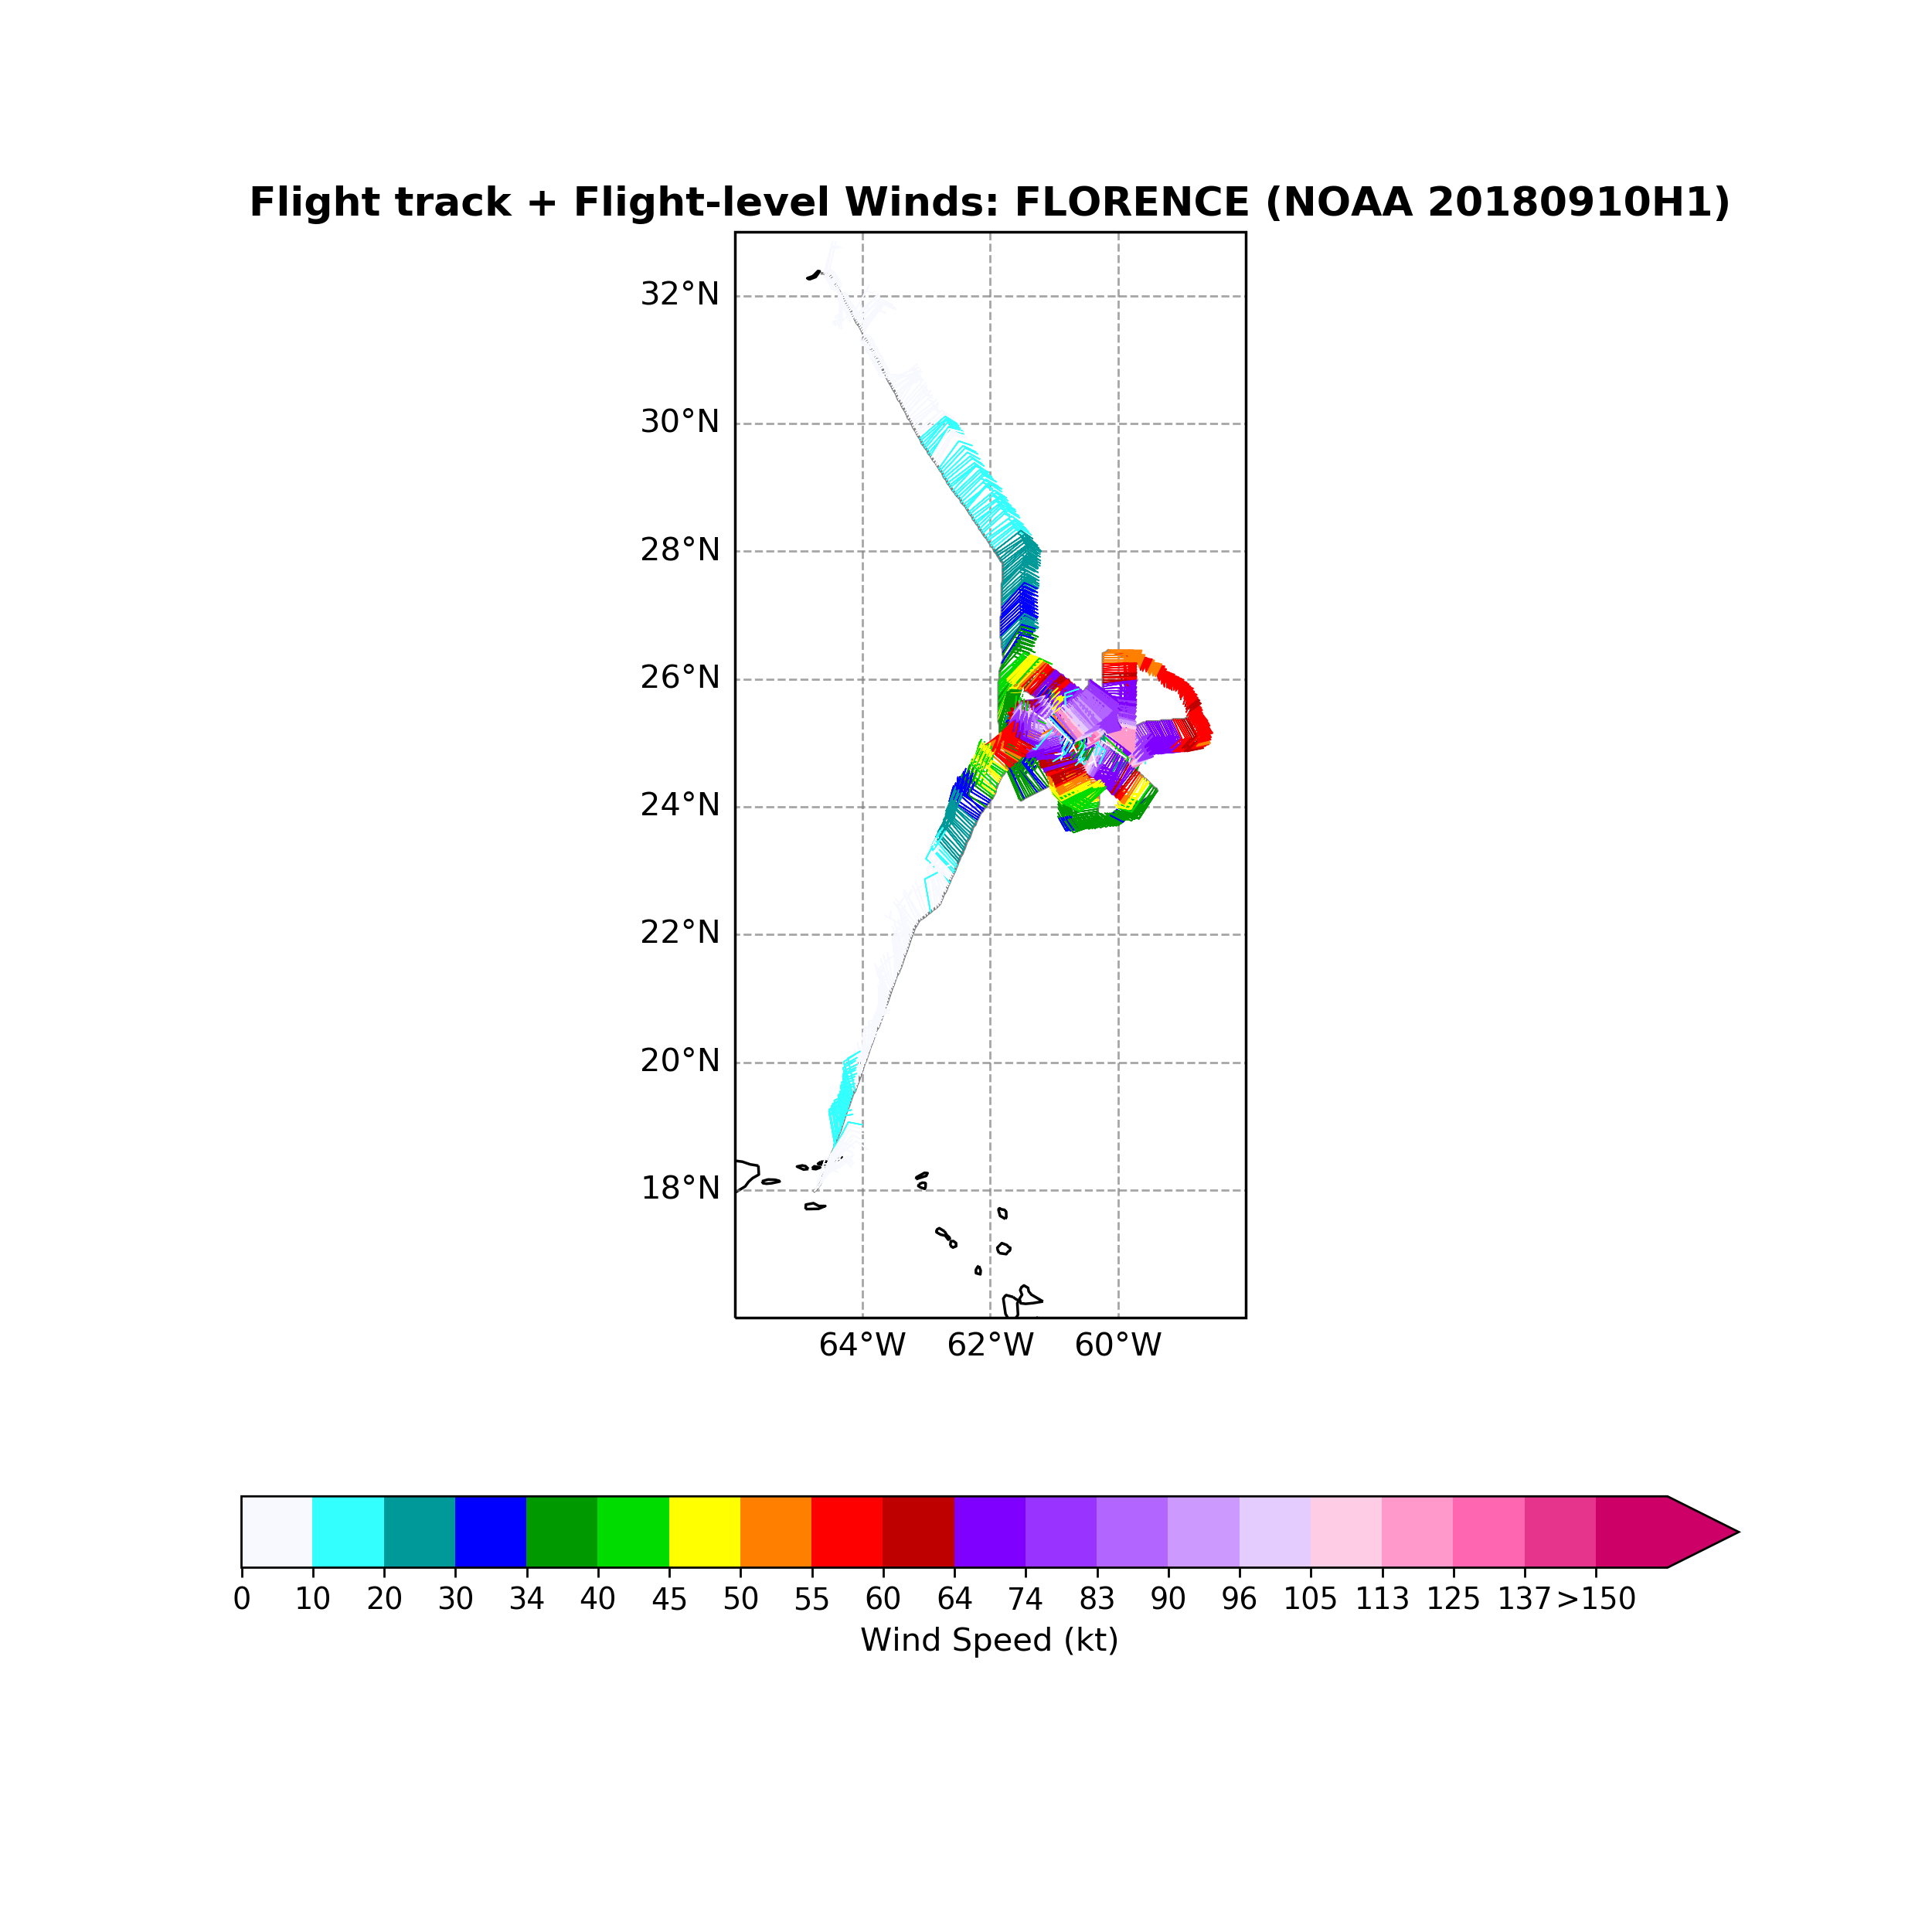
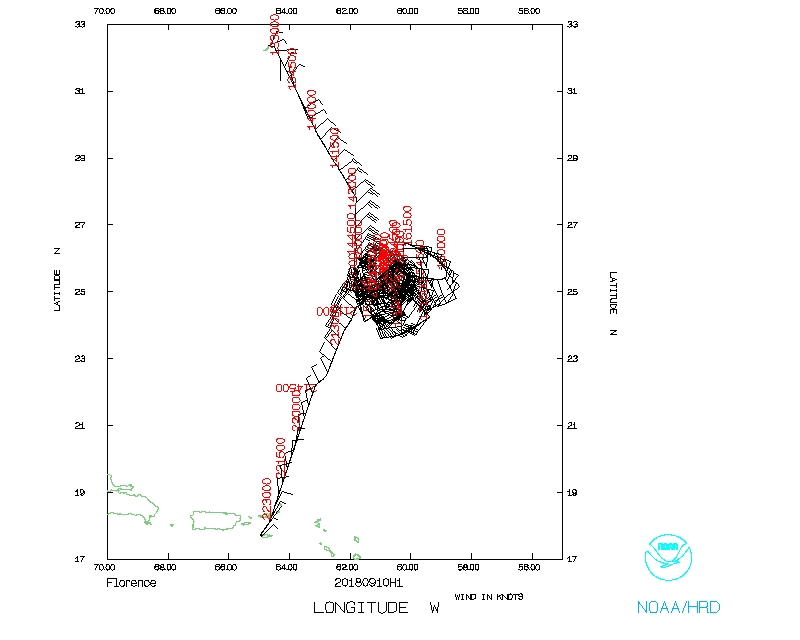
The actual track of the mission is shown in Figs. 6 and 7, with wind
information at flight level (FL), extrapolated minimum sea level pressure
(MSLP), and SFMR surface wind speed and rain rate shown in Fig. 8. The planned
azimuths and timing of the initial pass through the storm did not require any
updating at the pre-flight brief as we were delayed enough for the satellite
validation to be not as coincident. The takeoff had been delayed an hour due to
maintenance on the airplane after the previous day's flight. During our inbound
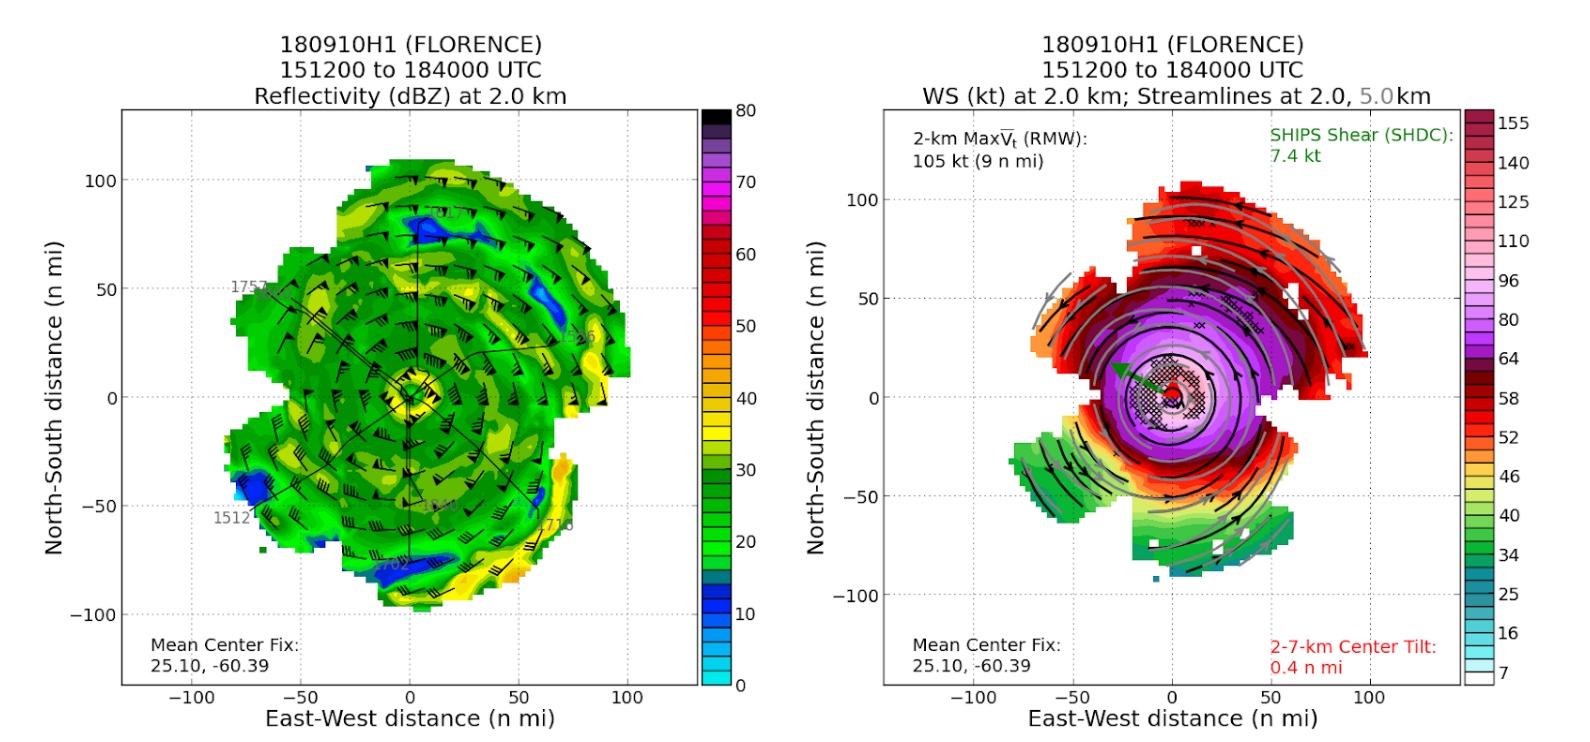
to the IP, Florence certainly continued to show increased symmetry in the CDO
within the inner core, suggesting that the precipitation was symmetric (which
the Tail Doppler radar [TDR] reflectivity composite from the mission confirms,
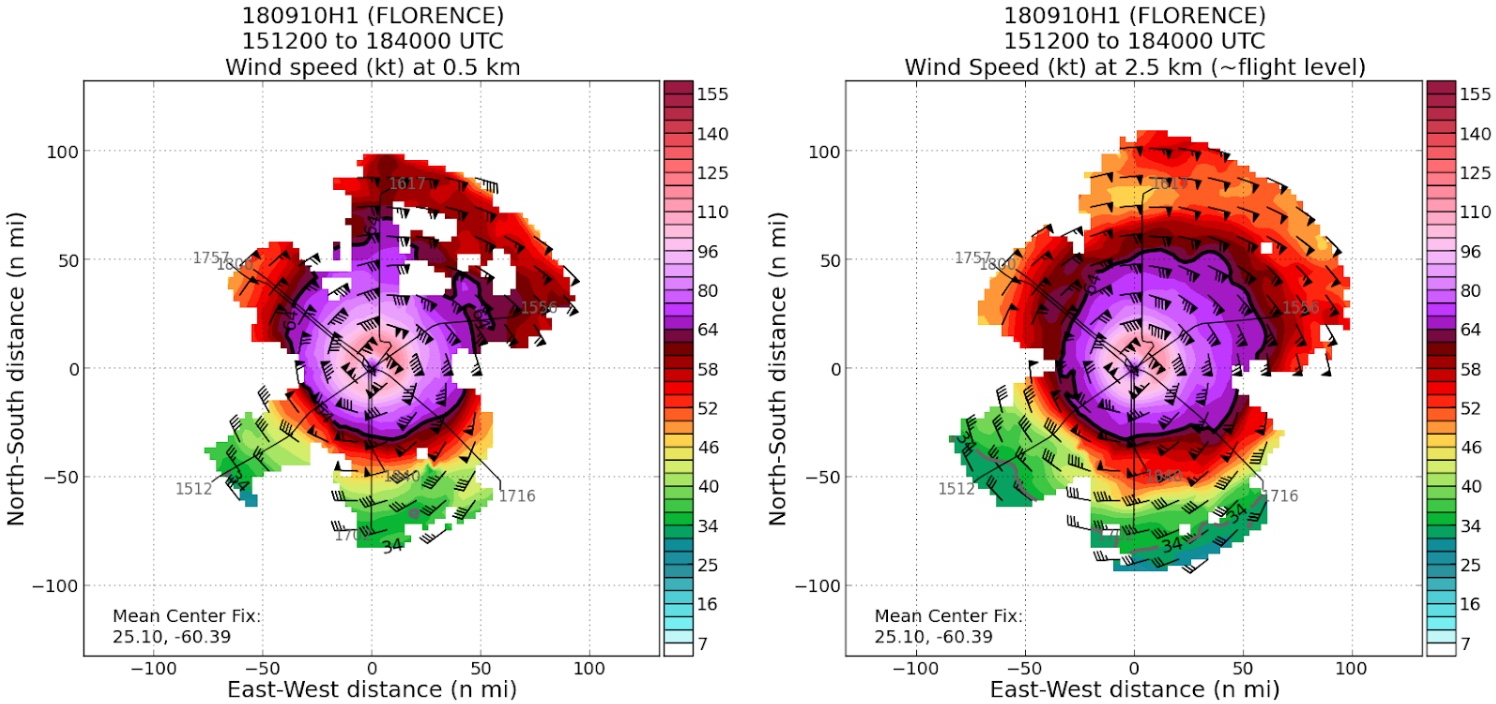
Fig. 9), and that intensification was likely continuing (TDR analysis confirms
a strong, symmetric inner core wind field, as well; Fig. 10).
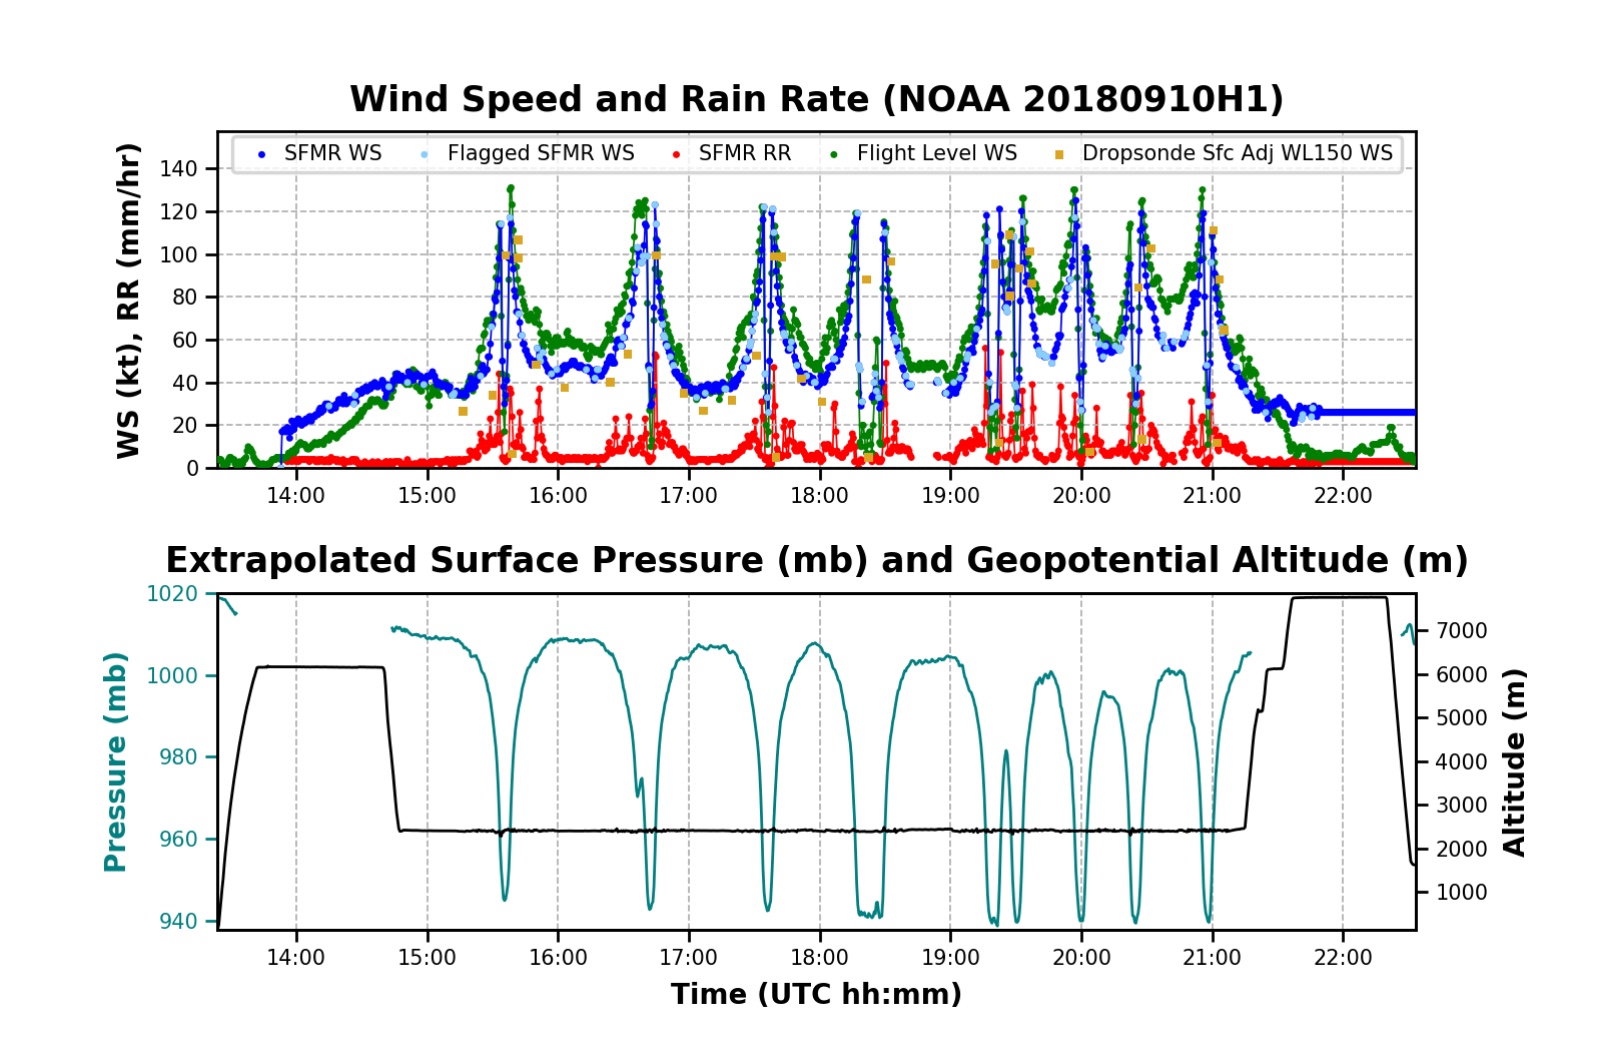
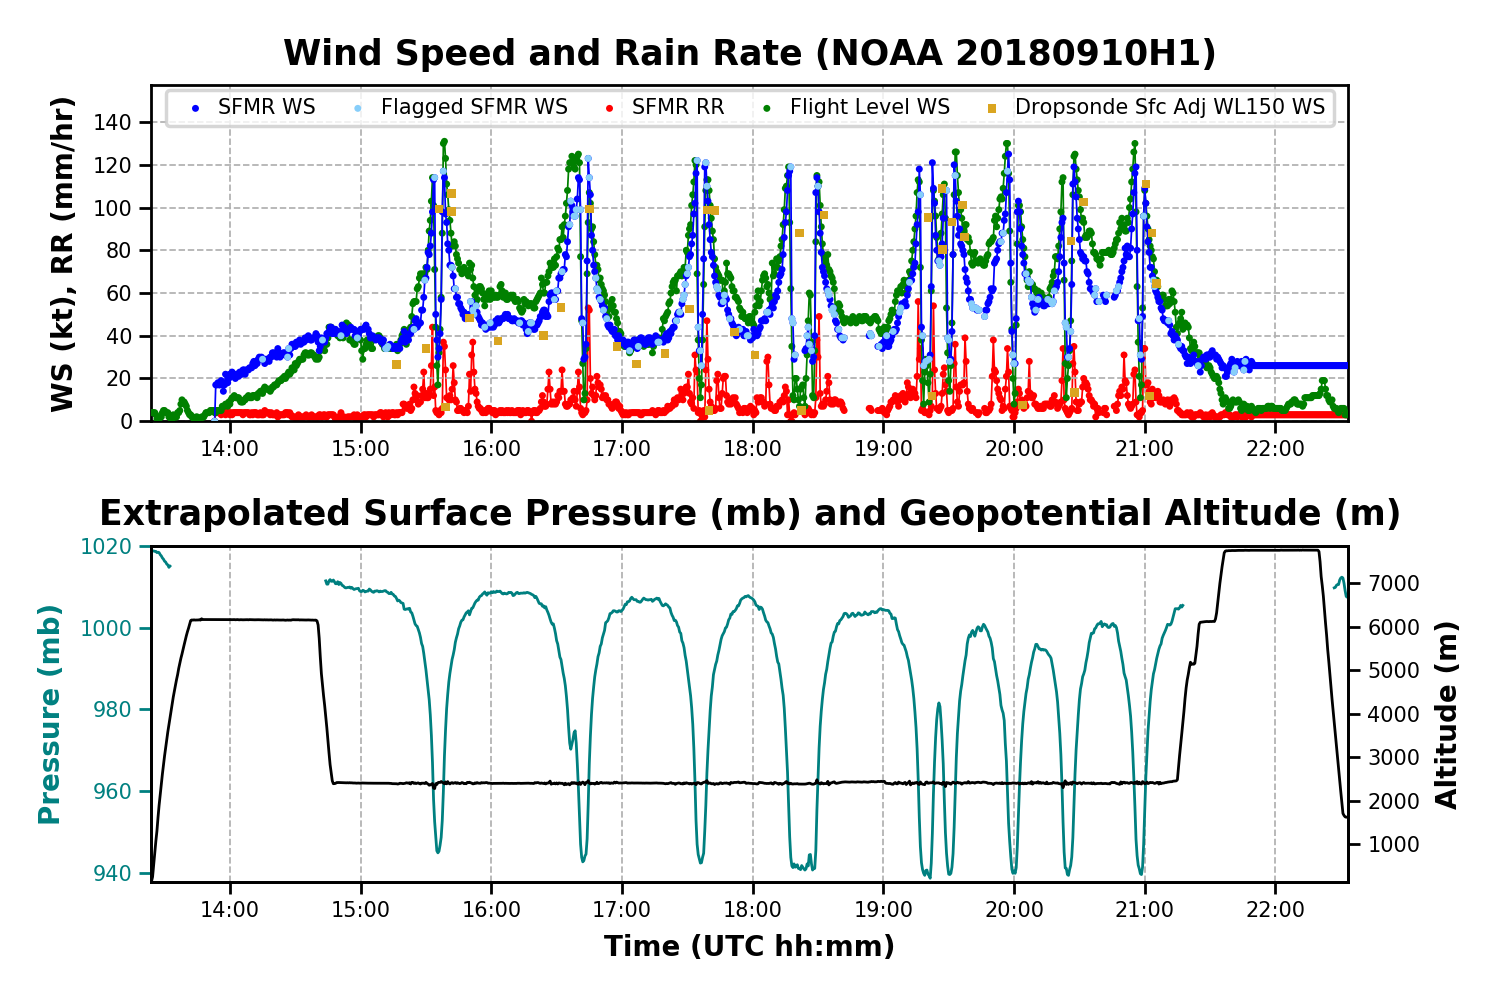
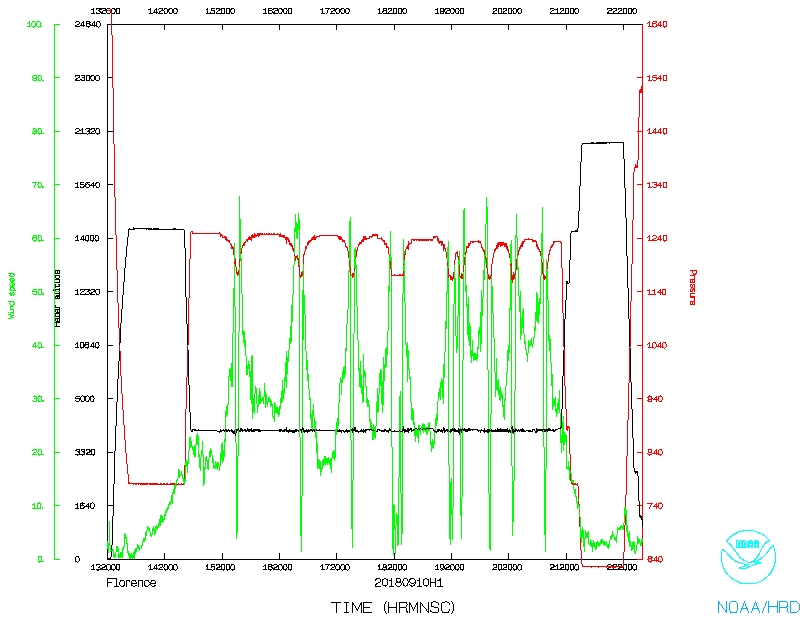
Figure 8. Time series of flight-level wind speed (green, kt), SFMR
surface wind speed (blue, kt), and SFMR rain rate (red, mm/hr) for mission
20180910H1, as well as the extrapolated surface pressure (mb) (bottom, teal,
mb) and altitude of the aircraft (bottom, black, m).
|
As we approached the IP, Jason Dunion also suggested that he was seeing a
possible diurnal pulse approaching the radius near our IP in the IR satellite
loop. We painted some of that band as we approached our IP on a pseudo downwind
approach from the north. After an 1.5 hour transit, we arrived at the IP around
1512 UTC, dropped a sonde (Sonde #1), and went inbound on the 240° azimuth
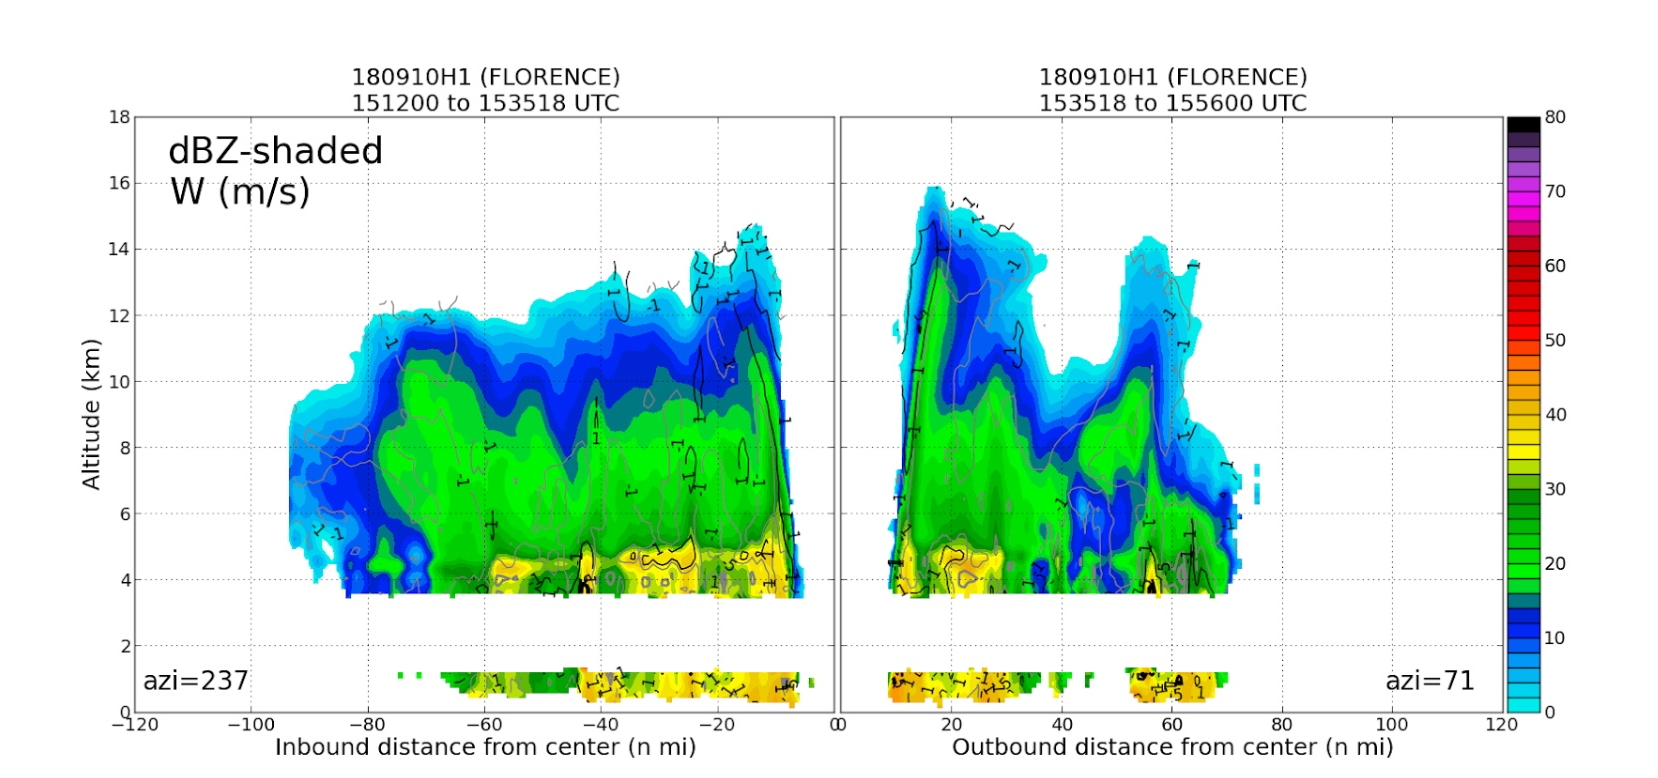
to the center. After a few minutes on the inbound leg we passed through that
possible diurnal pulse, but only observed echo tops to about 8 km. There was
some embedded convection, but the band was predominantly stratiform
precipitation (Fig. 11). We dropped a sonde at the midpoint (Sonde #2) of the
leg, and a sonde/AXBT (Airborne expendable bathythermograph) combo release at
the radius of maximum wind (RMW) (Sonde #3 / AXBT Combo #1), and proceeded into
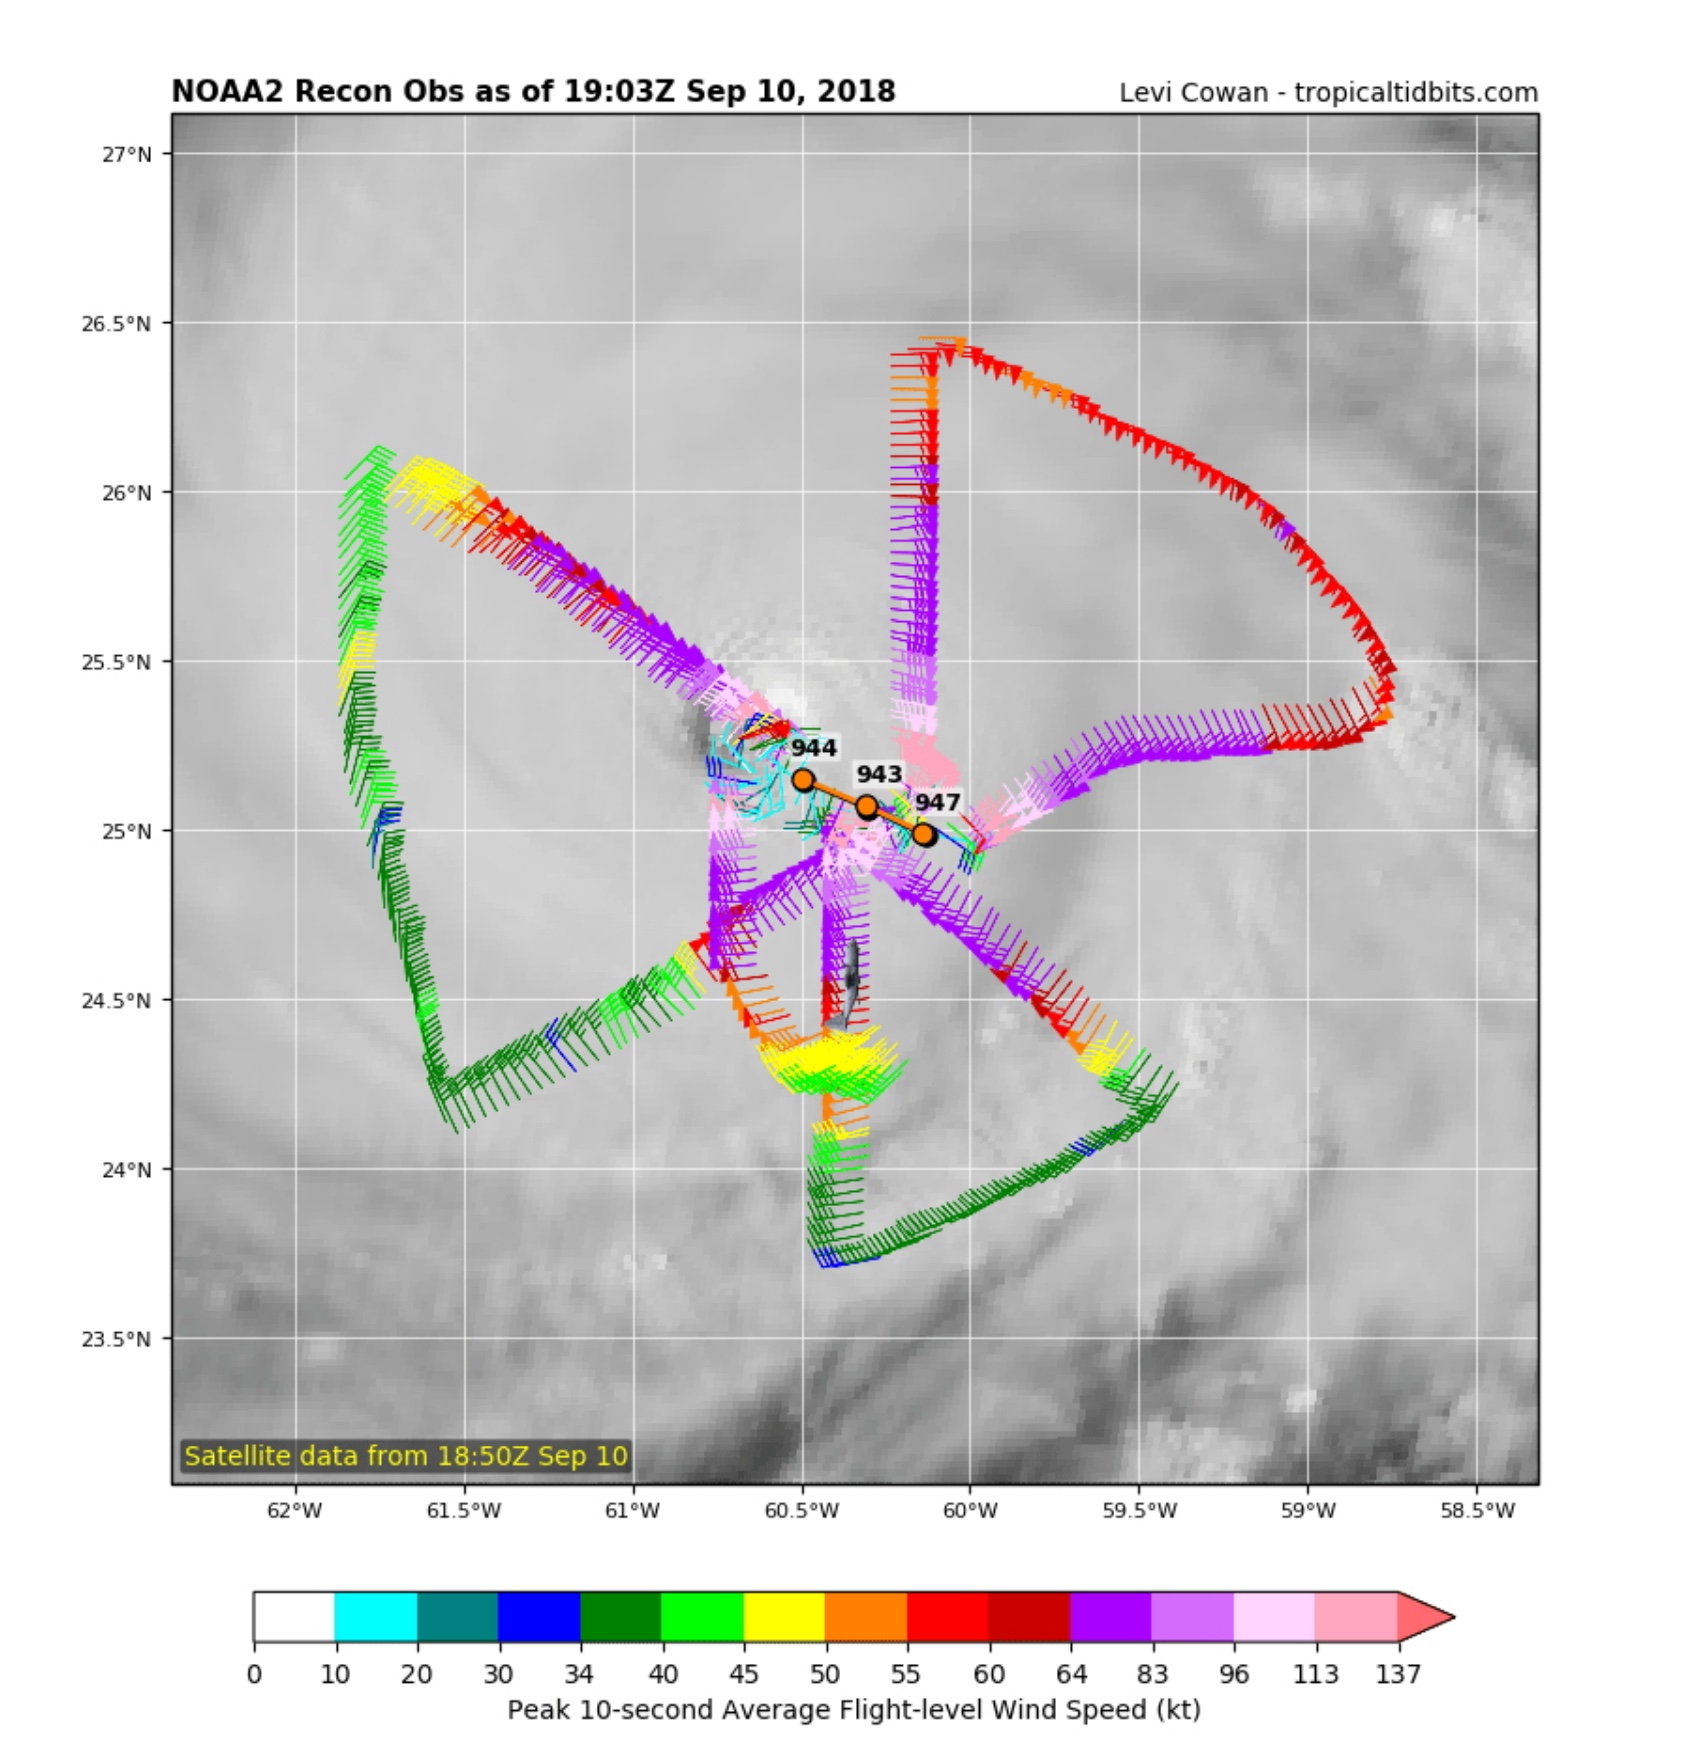
the eye. We did a "closest approach" (not a fix) of the
center at 1535 UTC, with an approximation of the center location near
24°59'N / 60°7'W. The extrapolated pressure from flight altitude was
945 hPa (Fig. 8), and a splash pressure of the center sonde (Sonde #4) of 947
hPa (Fig. 7). On the outbound leg, we released 2 RMW sondes (Sonde #5, #6),
with the first being an AXBT combo release (AXBT Combo #2). We also dropped a
sonde at the midpoint of the 060° outbound leg (Sonde #7), outside of a
rainband. As we went outbound, we had to deviate a little south, and track
more eastward to pass through an intense rainband stretching from the southeast
to the northeast (Fig. 9) at around 60-80 nmi from the center. Presumably this
band could have also had an origin as a diurnal pulse. We experienced quite a
bit of turbulence and observed a lot of deep convection in this band
(inbound/outbound TDR transect through center and band shown in Fig. 11).
After passing through it it's east, we called the endpoint for the radar
analysis at 1557 UTC, dropped the sonde (Sonde #8), and turned downwind to head
towards our northern point of the butterfly.
On the downwind leg, we were able to fly through a moat region, painting that
intense band off to the west of our track, pretty much all the way up from our
previous endpoint to the northern point for our next pass. We arrived at the
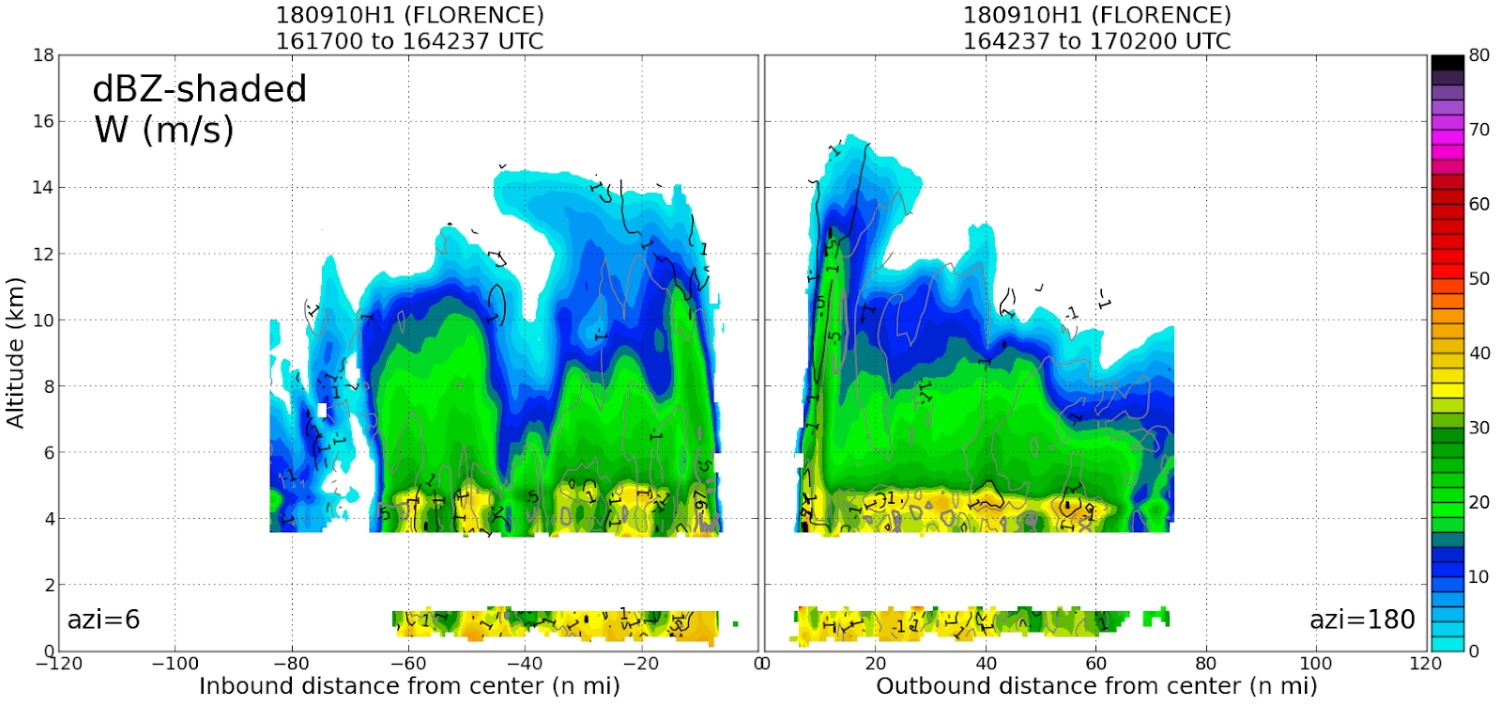
northern point at 1617 UTC (Sonde #9) and went inbound. We dropped the
midpoint sonde (Sonde #10) to the south of a rainband we passed through
- one of several on the way to the eyewall (Fig. 12). Another sonde was dropped
near the RMW (Sonde #11), and we proceeded to fix the center. The second center
fix was at 1642 UTC near 25°3'N / 60°19'W. The extrapolated MSLP was
942 hPa (Fig. 8), and the sonde surface pressure was 943 hPa (Sonde #12) (Fig.
7). On the outbound to the south, another RMW sonde was released (Sonde #13),
as well as the midpoint sonde as planned (Sonde #14). After about 40 nmi, the
conditions below the aircraft were much clearer, with a little less rain
coverage (Fig. 12). We arrived at the endpoint around 1702 UTC (Sonde #15) and
turned downwind for our final pass of the center for the butterfly pattern.
As we proceeded downwind to our southeast point, we were painting that intense
rainband (perhaps diurnal pulse that we first experienced on the east side on
our first outbound pass to the ENE, Fig. 11) with the TDR for much of the
downwind leg (Fig. 9, SE quadrant). Given that intense band intersected our IP
of our next inbound turn from the SE, we decided to turn inbound early on the
135° azimuth (315° heading), rather than the 120° azimuth, as
originally planned. We dropped a sonde at the turnpoint (Sonde #16) when we
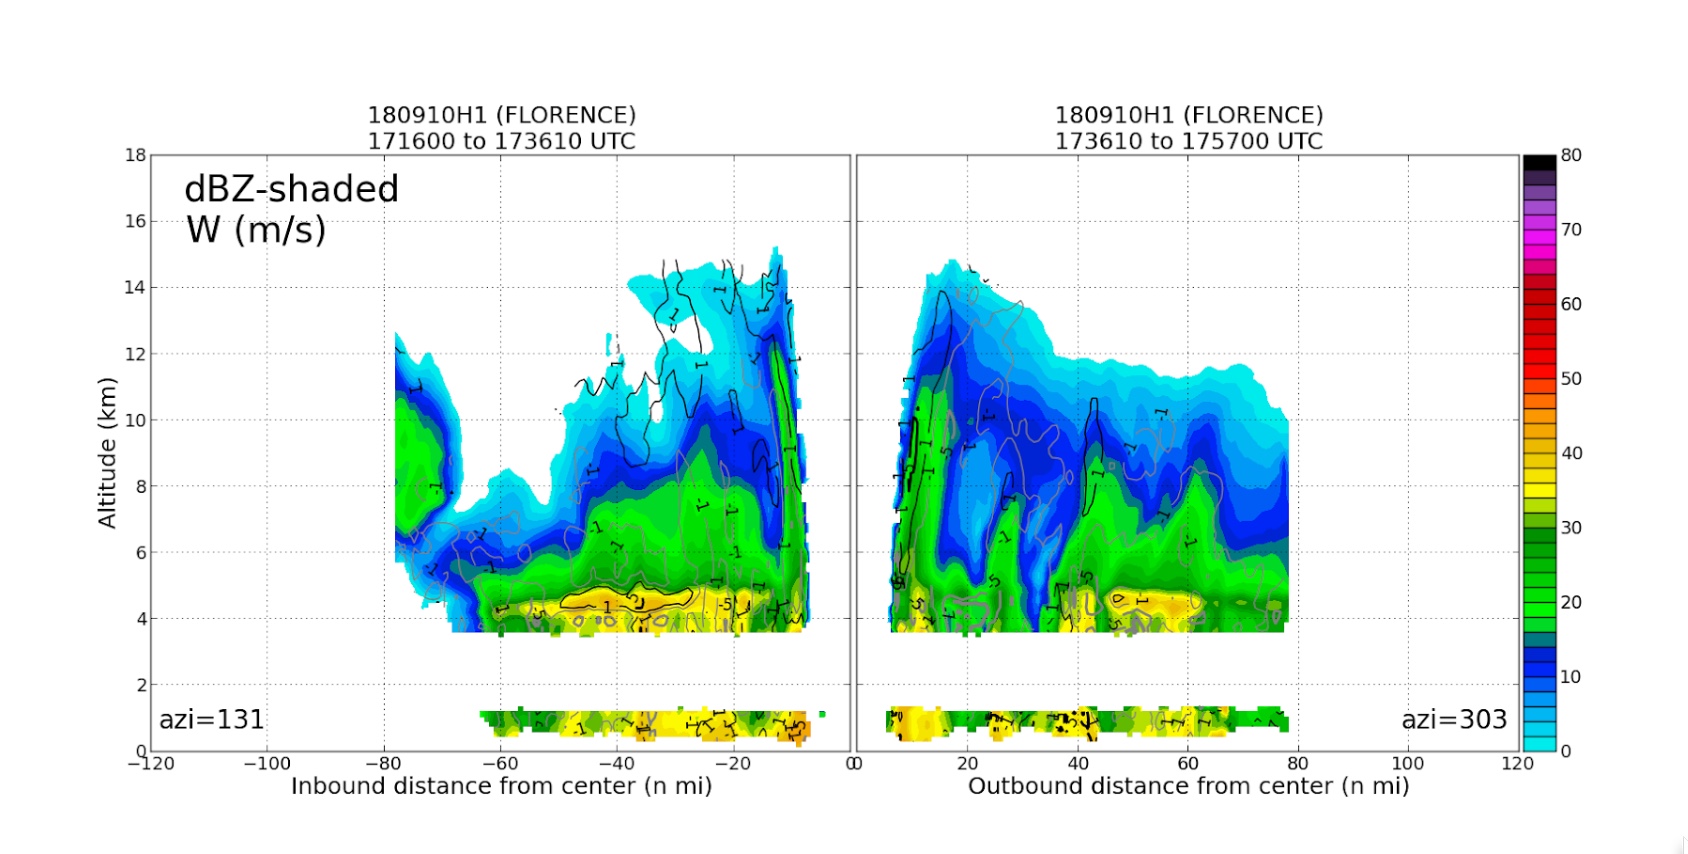
reached it around 1716 UTC. On the inbound, we again observed less persistent
precipitation (in coverage) radially inward of the intense band (Fig. 13).
Precipitation picked up again near the midpoint, where we released another
sonde (Sonde #17). As we approached the center inbound, an RMW sonde was
released with an AXBT (Sonde #18 / AXBT Combo #3). We fixed the center a third
time near 25°8'N / 60°31'W (Sonde #19) at around 1736 UTC. The MSLP on
this pass was consistent with the previous pass, ~943-944 mb. We proceeded
outbound on the 315° azimuth, dropping a final sonde combo at the RMW
outbound (Sonde #20 / AXBT Combo #4) and a sonde-only at the midpoint (Sonde
#21) on the leg. We arrived at the endpoint of the leg at 1757 UTC (Sonde #22),
which completed the butterfly survey pattern. In total, we were able to
complete 3 TDR analyses from the butterfly.
Upon reaching the endpoint to the northwest, we turned inbound to center on
the same azimuth. This marked the beginning of the Ocean Winds Module for
NESDIS and data collection of their IWRAP instrument. We dropped an RMW sonde
inbound on the 305° azimuth (Sonde #23), and fixed the center a fourth time
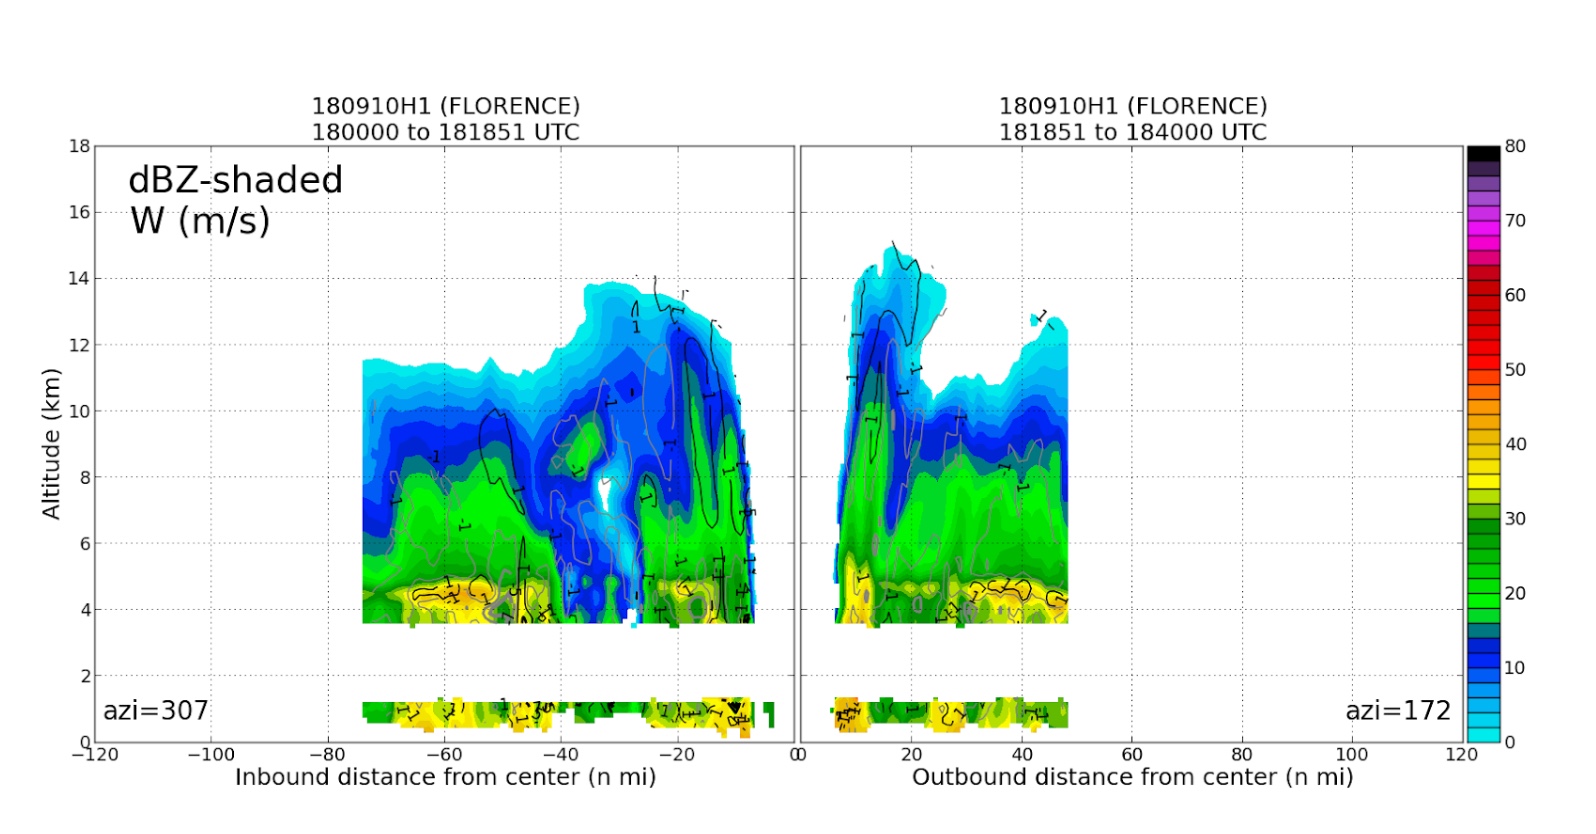
near 25.2°N / 60.6°W at 1818 UTC (center Sonde #24). From there, the
outbound was to the south, where we dropped another outbound RMW sonde (Sonde
#25). Considering the length of the inbound (305°) and outbound (180°)
legs, we were able to generate one final cross-section TDR profile analysis
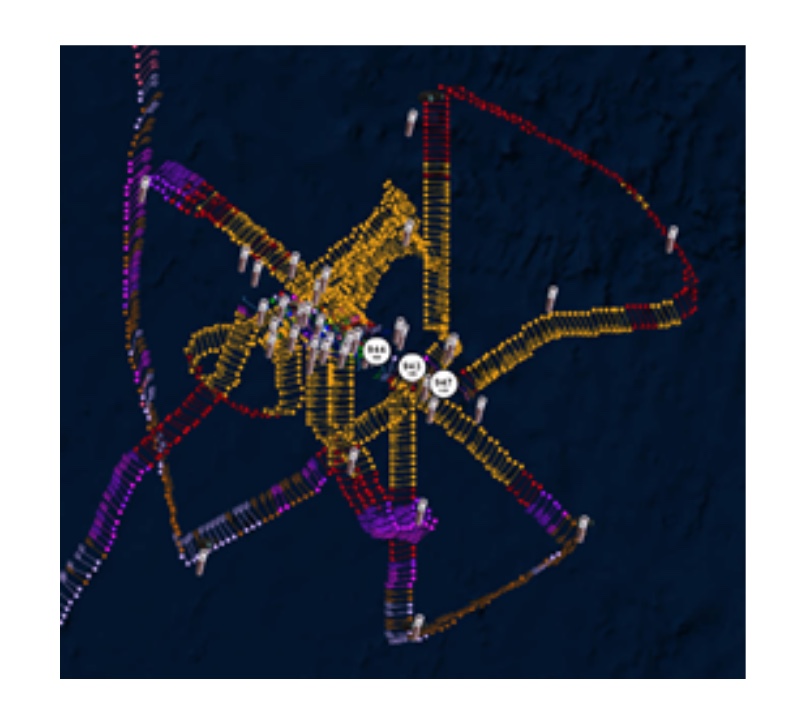
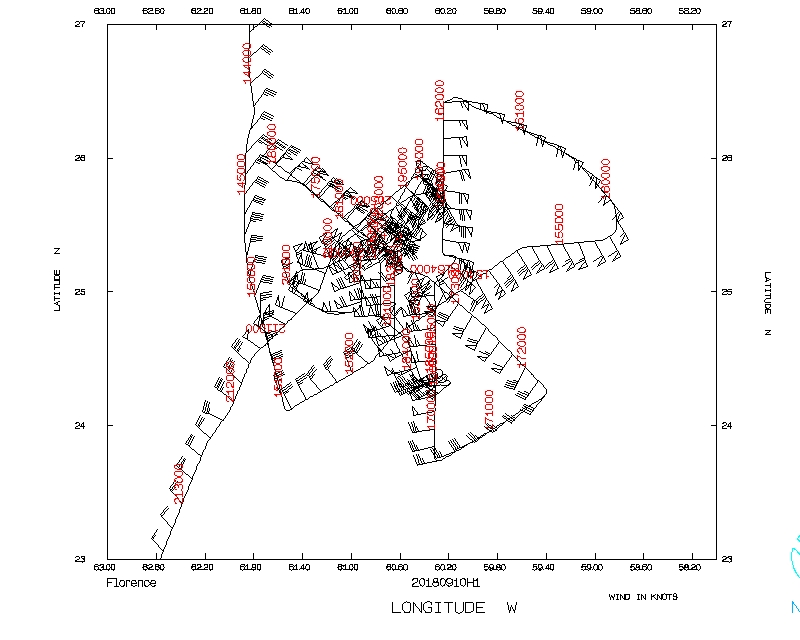
(Fig. 14). From this point until finishing the science portion of the mission,
there were a series of repeated legs basically between the S/SW and N/NE
quadrants of the storm for the NESDIS Ocean Winds module (Fig. 15). Sondes were
dropped inbound/outbound at the RMW on each radial penetration (Sondes #26-43),
with a few additional center fixes on passing. Overall the pressure was not
observed to drop much more during the flight (Fig. 8). In total, there were 6
additional passes through the center during this module.
Mission Evaluation / Problems :
Overall, we were able to observe the conclusion of the rapid intensification
(RI) event that had intensified the storm from 70 kt from the previous day's
mission, to nearly 125 kt observed during this mission. The MSLP did drop some
while we were in storm, from 946 down to about 942 hPa, but that was observed
between the first and second passes (note that the first pass was not an
official fix, so it could have been lower). NHC issued an updated advisory
from 100 kt to 120 kt (969 to 946 mb) after our first pass. The RI event
appeared to be ending while we were out there, as the MSLP did not drop much
(maybe a couple mb) during the mission. There was some suggestion of a
secondary wind maximum in the flight level winds in our passes through the
northern quadrants of the storm, but it wasn't a strong signature. This does
at least suggest possible development of a secondary eyewall formation (SEF)
forthcoming. Early in the mission, we also appeared to sample an intense
rainband associated with a diurnal pulse. It wasn't particularly impressive on
our first inbound from the SW (mostly stratiform), but was observed to be
intense on our outbound to the ENE (even required deviations on our outbound).
We should assess later as to whether this was a diurnal pulse and whether the
band we sampled to the SW is the same one as we sampled outbound to the ENE,
and subsequently to outbound to the south on the second pass through the storm.
We successfully completed the butterfly pattern, with full coverage of
dropsondes at the endpoints, midpoints, and center fixes. The AXBTs did not
give us any good data, therefore, we won't be measuring the surface fluxes, as
intended, at those 4 quadrants RMWs during the butterfly. The NESDIS Ocean
Winds measurements from IWRAP were also very successful during this mission,
as we did repeated passes through high winds and rain in the eyewalls during
an additional 6 passes of the storm center. Four TDR analyses were produced
and sent to EMC, 3 from the butterfly, and one additional one on the first of
the Ocean Winds Module.
The PIP was still not working during the mission; however the C-band on IWRAP
was fixed in time for the mission and collected a very unique dataset.
Jon Zawislak
Oct. 29, 2018
Mission Data :
Flight Director's log |
Flight Director's manifest |
NetCDF data |
1 second data |
serial data
LPS log |
Radar log |
Drop log
Page last updated Nov. 27, 2018
Return to Mission page.