Figure 1. Flight plan for 20180909H1 mission into Florence |
| Aircraft Commander | Justin Kibby |
| Co-pilot | Adam Abitol |
| Co-pilot | John Rossi |
| Co-pilot | Jeff Carrion |
| Co-pilot | Jeff Newnam |
| Navigator | Brian Richards |
| Flight Engineer | Paul Darby |
| Flight Engineer | Chris Lalonde |
| Flight Director | Mike Holmes |
| System Engineer | Joe Greene |
| Data Technician | Mike Mascaro |
| AVAPS Operator | Nick Underwood |
| Jon Zawislak | LPS | HRD |
| Heather Holbach | Dropsonde | HRD |
| Paul Reasor | Radar | HRD |
| Paul Chang | LPS | NESDIS |
| Zorana Jelnak | Observer | NESDIS |
| Joe Sapp | Observer | NESDIS |
| Radar | Nancy Griffin and John Gamache | HRD |
Mission Plan :
|
Figure 1. Flight plan for 20180909H1 mission into Florence |
NOAA42 will conduct a research mission for Objective #1 (AIPEX) of the Early Stage Experiment, as well as for the Ocean Winds Experiment (NESDIS IWRAP instrument). The initial plan calls for a butterfly pattern with 90 nmi legs (Fig. 1), which is oriented with an IP to southwest of the storm. We'll start inbound on the 240°/outbound 60° azimuths, then inbound 360° /outbound 180° azimuths, and finally inbound 120°/outbound 300° azimuths (similar pattern as yesterday's flight). The first leg is timed and oriented for a CYGNSS overpass beginning around 1400 UTC. We'll likely have to leave a few minutes early to arrive at the IP around that time. There will be dropsondes at the endpoints, midpoints, and centers in the butterfly, and at the radius of maximum wind (RMW) as dictated by our objectives. AXBT combo drop with dropsondes are anticipated at the midpoints, a couple of the endpoints, as well as at the start of the SFMR High Incidence Angle module (part of the SFMR Experiment, Objective #1), if flown. Time permitting, following the completion of the butterfly survey pattern, we'll proceed into repeated penetrations in high wind and rain areas for Ocean Winds, legs that could also serve as a convective burst module to address Objective #2 of the Early Stage Experiment. Sondes would be required for that module. NHC requested fixes and sondes for every center pass.
Tropical Storm Florence continues to shown signs of more organization, and could be at hurricane strength when we get out there (IR imagery, Fig. 2, visible imagery, Fig. 3). The symmetry of the convection around the center has vastly improved since yesterday. Favorable anticyclonic outflow certainly seems to be developing, which suggests that the shear is no longer an inhibiting factor; though a strong shear zone is still present to the north of the storm (Fig. 4). The only inhibitor for further intensification could be the dry air that we saw surrounding the storm yesterday, which satellite imagery suggests could still be present to well outside of the storm to the north/northwest (Figs. 2, 3), but it seems unlikely that this is impacting the storm in any way. As of the 5 AM AST NHC advisory, Tropical Storm Florence is located near 24.6°N/54.7°W, MSLP of 989 hPa, intensity of 60 kt, and moving west at 4 kt. The 1800 UTC SHIPS (valid towards the end of the mission) is 188°/3 kt (1200 UTC SHIPS is 303°/13 kt), a decrease from the SHIPS analysis yesterday. Given the low shear, high SST, and likely improved humidity environment, rapid intensification (RI) seems like a possibility at some point soon, if it isn't already happening. The satellite signatures certainly suggest RI is possible and the NHC forecast is consistent with RI in the next 12-24 hours as it continues to move westward (Fig. 5).
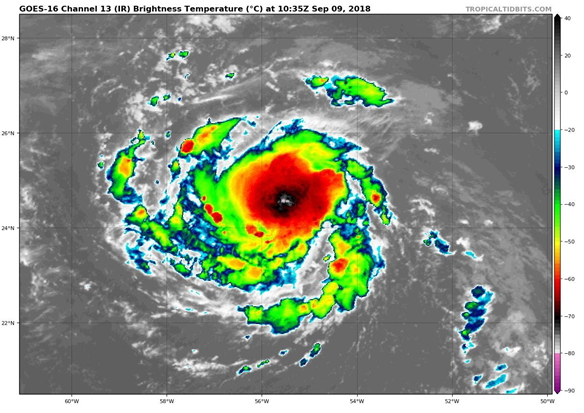 Figure 2. GOES-16 IR imagery of Florence from 1035 UTC 9 September [Tropical Tidbits] |
 Figure 3. GOES-16 visible imagery of Florence from 1035 UTC 9 September [Tropical Tidbits] |
|
Prepared by the Hurricane Research Division Aircraft: N42RF Proposed takeoff: 9/1200Z
DROP LOCATION TABLE
| #
| LAT
| LON
| RAD/AZM
| Time
|
| deg min
| deg min
| nmi/deg
| hr:min
| 1S | 23 57 | 58 01 | 90/240 | 1:54
| 2S | 25 27 | 55 10 | 90/060 | 2:40
| 3S | 26 12 | 56 36 | 90/360 | 3:03
| 4S | 23 12 | 56 36 | 90/180 | 3:48
| 5S | 23 57 | 55 11 | 90/120 | 4:12
| 6S | 25 27 | 58 02 | 90/300 | 4:57
| | ||||||||||||||
Mission Summary :
| Take off | Landing
| Bermuda
| 11:42 UTC
| Bermuda
| 19:51 UTC
| Penetrations
| 5
| Expendables
| 24 Dropsonde (14 HRD, 4 NWS,
6 NESDIS) | AXBT 8 (6 good SSTs) | ||||||
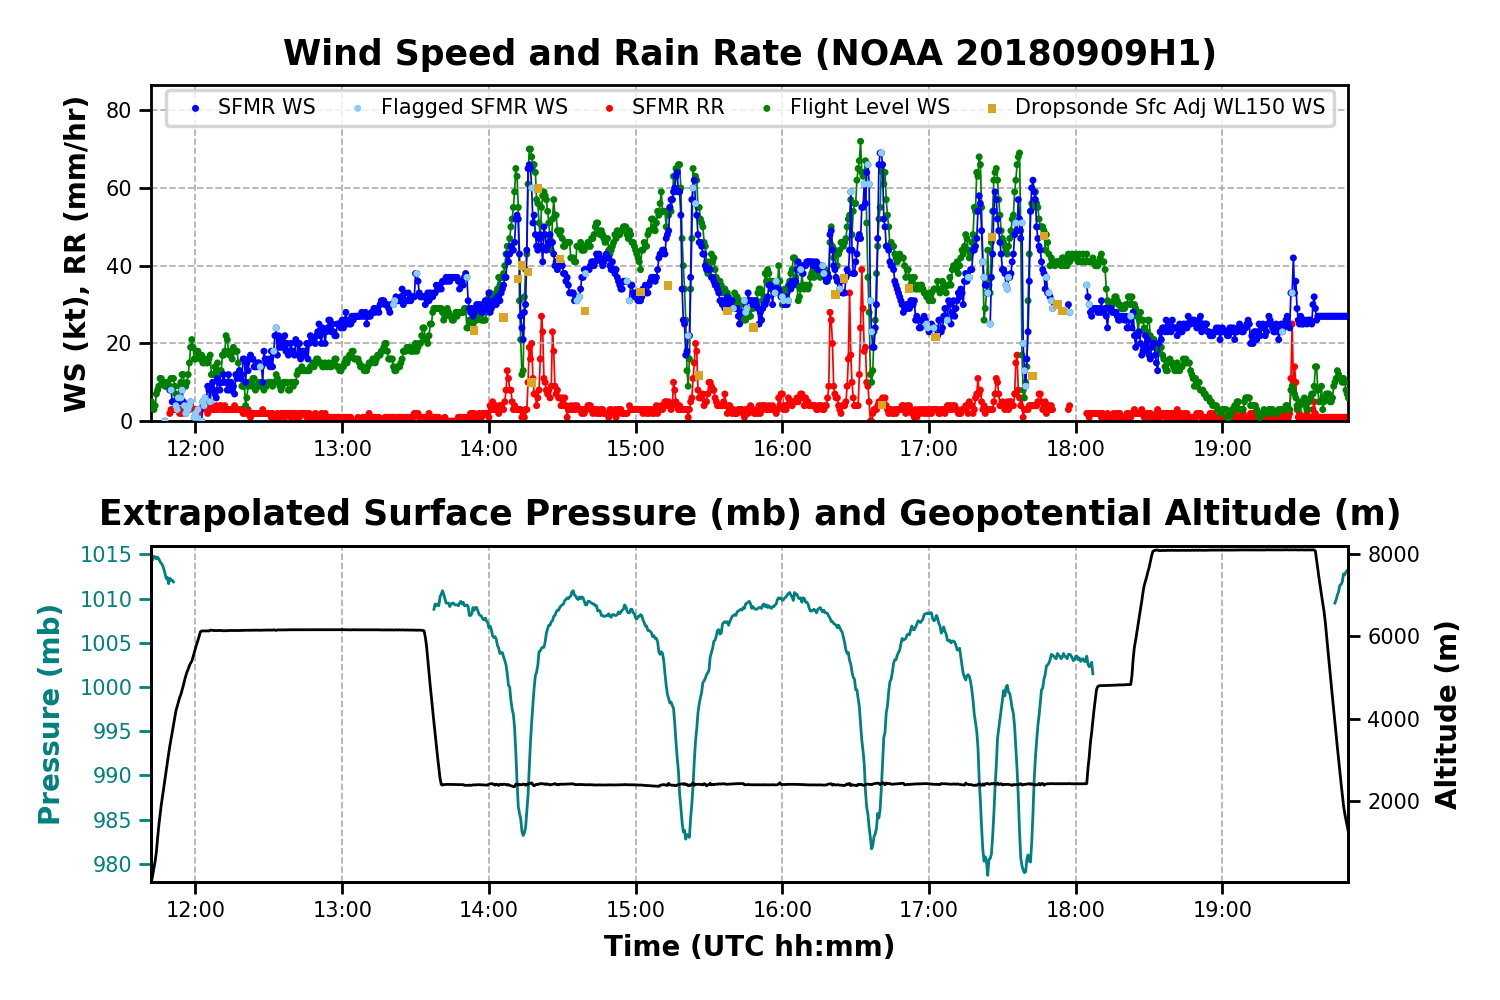
The actual track of the mission is shown in Fig. 6, with wind information at flight level (FL), extrapolated sea level pressure (SLP), and SFMR surface wind speed and rain rate shown in Fig. 7. The planned azimuths and timing of the initial pass through the storm for the CYGNSS overpass did not require any updating at the pre-flight brief. We only needed to leave a little bit early. After a 2 hour transit, we arrived at the IP around 1350 UTC, dropped a Sonde (Sonde #1), and went inbound on the 240° azimuth towards the center. We dropped a sonde and BT combo (Sonde #2 / AXBT Combo #1) near the midpoint. In addition, sondes were dropped for NESDIS near the RMW on this inbound (3 in total; Sondes #3, #4, #5). For NESDIS purposes in staying on time and aligned on the track of the CYGNSS overpass, we did not fix the center (instead fixed the closest approach, CPA) and went outbound. The CPA of the center at 1413 UTC was near 24°20'N/56°9'W, and had an extrapolated pressure of 982 hPa (Sonde #6). NESDIS dropped another sonde at the outbound RMW (Sonde #7). We proceeded outbound on the 060° azimuth, dropping a combo at the midpoint (Sonde #8 / AXBT Combo #2). On the outbound, we experienced substantially more precipitation on that east side (Figs. 8, 9), as compared to the west side, with a lot more characteristically cellular convection (Fig. 10). We also observed a 70 kt peak FL and 66 kt SFMR surface wind on the outbound leg to the northeast. This information led to Florence being upgraded back to a hurricane in the 11 AM / 1500 UTC NHC advisory. The timing of the CYGNSS underpass went very well.
 Figure 5. NHC forecast for Florence from the 5 AM AST forecast advisory on 9 September |
A sonde was dropped at the endpoint (Sonde #9) to the northeast of the center, and we turned downwind for the northern point. At this time, IR satellite imagery suggested some new convection developing within the eyewall, appearing strongest on the east side. We arrived at the northern turnpoint at 1458 UTC, dropped a sonde (Sonde #10), and went inbound towards the south. We dropped the midpoint combo (Sonde #11 / AXBT Combo #3) on the inbound. Overall, the conditions on the inbound to the north of the eyewall seemed pretty stable - not as much precipitation, just some scattered clouds and the CDO above (Figs. 8, 11) - perhaps evidence of a continued impact from the dry air that we observed in the previous flight. We did not drop an RMW sonde, and reached the center at 1521 UTC. We fixed the center at 24°19'N/56°22'W. The center sonde splash pressure was 982 hPa (Sonde #12). The eyewall was nearly fully closed, with just some evidence of an opening on the east side. The lower fuselage radar (MMR), however, suggested pretty intense convection in the southern eyewall, and definitely more banding and precipitation coverage on the south side. The TDR analyses confirm this coverage (Figs. 8, 11). We had to deviate some to the west on the outbound to the south due to that intense convection in the southern eyewall. No RMW sonde was dropped on the outbound, only the combo drop at the midpoint of the leg (Sonde #13 / AXBT Combo #4). Towards the end of this outbound leg, we had to deviate around a convective band, which required a heading of 153°. Given this large deviation, we decided to end the TDR analysis around 1538 UTC, prior to this deviation to maintain a decent profile analysis. We arrived at the southern endpoint at 1544 UTC, dropped a sonde (Sonde #14), and proceeded downwind.
On the downwind leg, we were flying parallel and radially outward of a very intense outer rainband. It was a challenge finding an entrance through this band to go inbound, particularly at the original 90 nmi SE point on the 120° azimuth. While we had to deviate and could not go inbound on our original azimuth, the good news was that the band was pretty interesting and we were able to paint it with the TDR as we continued further downwind. The LPS also decided to add an additional drop to the new endpoint, by dropping a sonde on either side of the rainband (Sonde #15, #16), to get a look at the inflow and outflow properties of the band. We went inbound on the 100° azimuth (20° downwind of the original plan). Passing through the band inbound we observed mostly stratiform precipitation, but multiple areas of high echo tops from some convection (on the inward side) (Fig. 12). We successfully dropped both sondes, radially outward and radially inward. Was this band a result of the diurnal pulse? We were able to continue inbound towards the center on that 105° azimuth, correcting a bit towards the west, before trying to enter the eyewall on a heading closer to 300°. We had to go through a fairly intense band before reaching the eyewall and experienced moderate turbulence. No sonde / AXBT combo was dropped at the midpoint of this leg. We requested a 120° heading out of the eye to go back and fill some of the gaps in radar coverage in the southeast quadrant since we didn't go inbound on the original azimuth, but just wasn't enough space between the convective bands outside of the eyewall in the SE quadrant to go out and back easily. We fixed the center a third time at 1636 UTC near 24°23'N/56°29'W, and had an extrapolated MSLP of 981 mb, splash pressure of 984 mb from the sonde (Sonde #17). Inside the eye, the MMR suggested very strong convection on the west and southern eyewalls. We had to pass around an convective finger in the east-southeast eyewall (experienced clear air turbulence in the eye from this). Once we got around that we were able to go outbound 300° to complete the butterfly. We dropped a midpoint combo (Sonde #18 / AXBT #5) in an environment of scattered shallow to moderately deep clouds. We dropped the last sonde of the butterfly at the 90 nmi radius on the 300° azimuth in the northwest quadrant at 1658 UTC (Sonde #19).
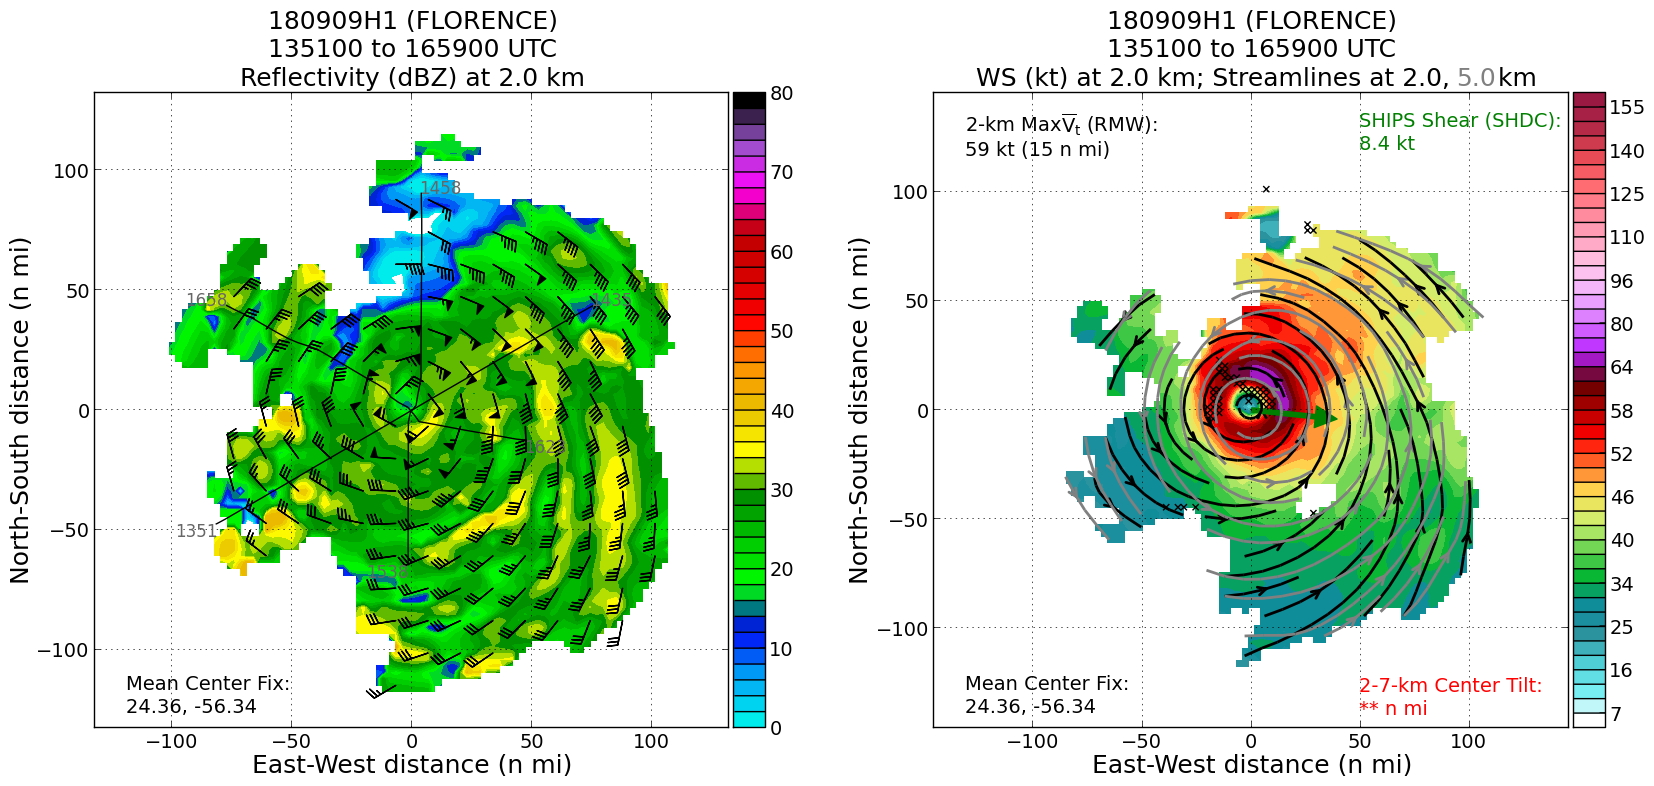 Figure 8: Composite reflectivity and winds at (left) 2 km, as well as (right) windspeed at 2 km (shaded) and streamlines at 2 (black) and 5 km (grey) |
 Figure 9: Composite winds at (left) 0.5 and (right) 2.5 km |
After completing the butterfly, NESDIS decided to go back inbound on the same azimuth to the center again, passing through a high wind (hurricane strength) region we had just flown through on the outbound to complete the butterfly. We had to deviate for some convection in the eyewall and therefore ended up coming in on the 270° azimuth. We dropped an RMW sonde combo (Sonde #20 / AXBT #6) and went into the eye. This RMW sonde had a surface pressure of 986 mb, suggesting that the central pressure was likely deepening. There was no center fix. We turned in the eye, went outbound on 250° azimuth, but NESDIS did not like the windspeeds there, so we turned around and went back in. Instead we would focus on the 300° azimuth, and do circles for NESDIS and the SFMR High Incidence Angle module when we observed an area with visual meteorological conditions and at least 30 kt winds outside of the eyewall on that azimuth. Upon getting back to the eye, we fixed the center one more time (Sonde #21). This center fix was around 1726 UTC near 24°26'N/56°43'W. The extrapolated pressure in this final center fix was 977 mb, certainly lower than MSLP observed earlier. After the fix, we went outbound on the 300° azimuth, dropping a sonde combo at the RMW (Sonde #22 / AXBT #7). After waiting a few minutes to get into visual meteorological conditions with minimum threshold windspeeds (> 30 kt), we started the circles (3 at 30° bank and 5 at 45° bank). Winds were just high enough (~30 kt for the SFMR circles module) for both SFMR and NESDIS interests. A sonde combo was dropped at the start of the circles (Sonde #23 / AXBT #8), although another sonde (Sonde #24) was dropped after an indication that the first (Sonde #23) was a fast fall (Sonde #23 only ended up being a partial fast fall on the initial descent). After the circles were complete, we ended the science portion of the flight and headed back to Bermuda. As we left the storm, we still saw the deepest convection on the south and southeast sides (Fig. 13), and certainly a suggestion from the flight observations that deepening (Fig. 7) was likely occurring.
 Figure 10. TDR reflectivity (shaded) and vertical velocity (contoured) cross section from SW to NE between 1351 and 1435 UTC. |
 Figure 11. TDR reflectivity (shaded) and vertical velocity (contoured) cross section from N to S between 1458 and 1538 UTC. |
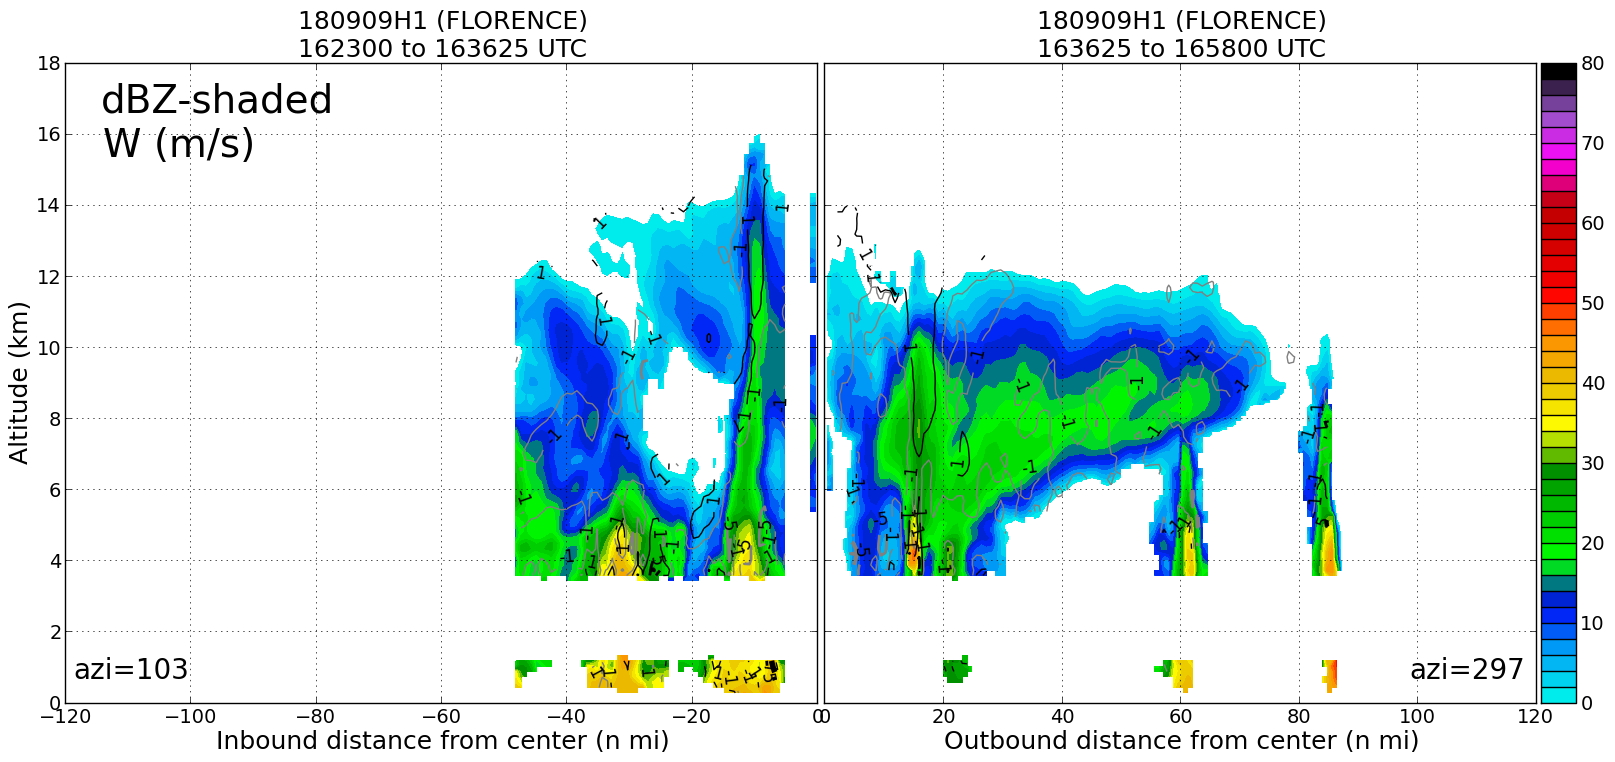 Figure 12. TDR reflectivity (shaded) and vertical velocity (contoured) cross section from E to WNW between 1623 and 1658 UTC. |
Mission Evaluation / Problems :
Overall, this was a very interesting mission during an important part of Florence's life cycle. It most certainly seems that, at the time, we were sampling the beginning (onset) stage of a rapid intensification event. We saw quite a bit of convective cycling around the developing eyewall, and while the pressure did not drop immediately, we did start to see the MSLP drop below 980 hPa on our last couple of passes (Fig. 13). The MSLP (observed from the dropsondes) started around 984 hPa, and it was perhaps as low as 977 mb (extrapolated MSLP from flight level) by the end of the mission. In cooperation with the NESDIS Ocean Winds portion of the flight after the butterfly, we had a pseudo convective burst module on the west side of the storm after we went outbound on 300° for the final butterfly leg, went immediately inbound on the same azimuth at the end of the leg, ending up on the 270° azimuth, and then returning outbound/inbound on the 250° azimuth. Although most of the deepest convective burst activity at this time was on the south and southeast side of the storm, it does appear that we sampled it when it was closer to the western side of the eyewall on our inbound/outbound on the third pass of the butterfly, from ESE to NW. There certainly was an interesting convective evolution in the eyewall during the mission, and this should be of interest to those researching the role of convective bursts during the onset of (rapid) intensification. We also sampled an intense rainband on our downwind leg in the southeast quadrant, even dropping a sonde radially outward and inward where we went inbound for our third pass to the east of the storm.
 Figure 13. IR satellite image of Florence at 1745 UTC 9 September (NRL) |
Six RMW sondes were deployed for NESDIS Ocean Winds, and we combined 2 of those drops with AXBTs in the interest of determining surface flux measurements in the high wind regions. Other combination drops were at the midpoints of the butterly. Also at the request of NESDIS, we did 3 left hand turn circles at a 30° bank, and followed those up with 5 circles at a 45° bank for the SFMR High Incidence module (Objective #1 of the SFMR Experiment). The winds appeared to just meet the threshold (>30 kt) for the SFMR module, and we were able to save an AXBT and sonde for the start of that module.
Overall, the storm was intensifying at the end of the mission, and we likely captured the storm at the onset of the rapid intensification, as had been forecast to likely occur. We achieved decent coverage from the TDR (Figs. 8, 9), as the precipitation and wind was asymmetric in the composite. Precipitation was maximized on the south and east side in coverage, while the surface wind peaked in the northern quadrants (Fig. 9). In addition to accomplishing data collection for Objective #1 (AIPEX) of the Early Stage Experiment, we also were able to get some data for Objective #2 (Convective Burst Module) as we were able to get some repeated passes of the eyewall on the west side in a pseudo convective burst module.
The Precipitation Imaging Probe (PIP) was not working (discovered prior to the mission and attempted to be fixed by the Data Technician), and the c-band frequency on IWRAP was not operational. We struggled to keep a good downwind and our inbound azimuth on 120° due to that strong rainband, but overall it did not hinder our ability to get well spaced azimuths for TDR coverage for the analyses (Figs. 8, 9).

Timeseries wind, SFMR wind, rain rate, altitude and pressure plots |

Flight-level wind plot |
 Flight track |
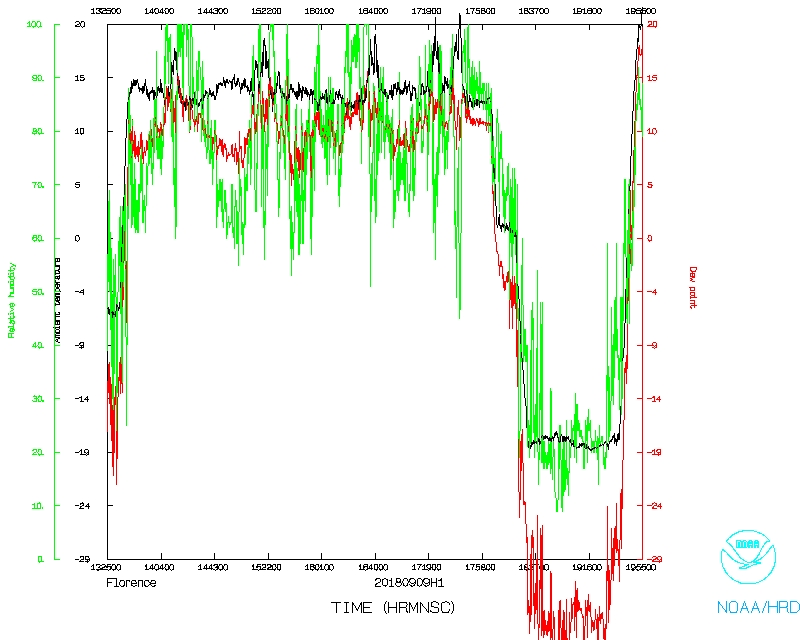 Temperature and Moisture |
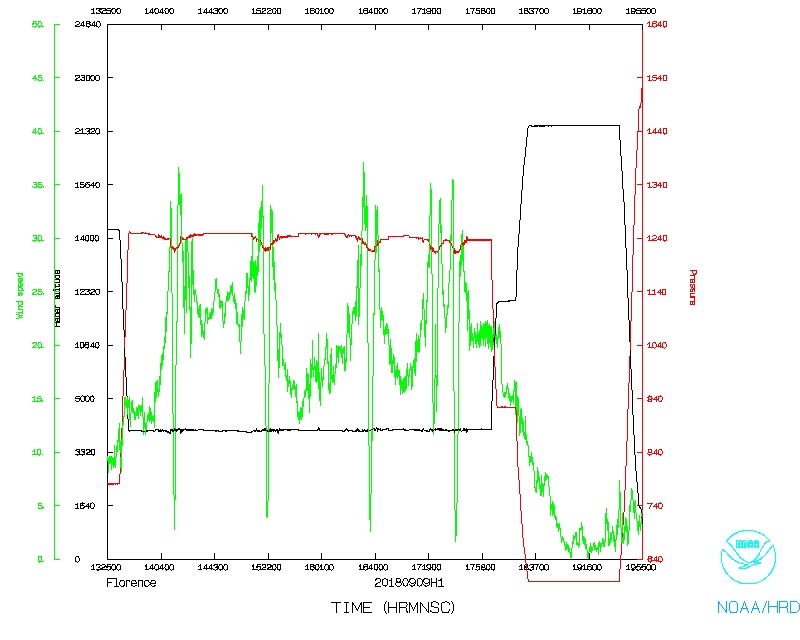 Wind and Atlitude |
 Flight track |
Flight Director's log |
Flight Director's manifest |
NetCDF data |
1 second data |
serial data
LPS log |
Radar log |
Drop log