Mission Summary
20180708H2 Aircraft 42RF
Tropical Storm Chris (AL03)
Tail Doppler Radar
Aircraft Crew (42RF)
| Aircraft Commander | Justin Kibbey
|
| Co-pilot | Adam Abitol
|
| Co-pilot | Pat Didier
|
| Flight Engineer | Ken Heystek
|
| Flight Engineer | Paul Darby
|
| Navigator | Pete Freeman
|
| Flight Director | Rich Henning
|
| System Engineer | Bobby Peek
|
| Data Technician | Todd Richards
|
| Data Technician | Terry Lynch
|
Scientific Crew (42RF)
| LPS/Radar | Hui Christopherson | HRD
|
| LPS/Radar | Frank Marks | HRD
|
| Dropsonde | Gus Alaka | HRD
|
| Observer | Erin Jones | HRD (Hollings)
|
Scientific Crew (Ground)
| Radar | Paul Reasor | HRD
|
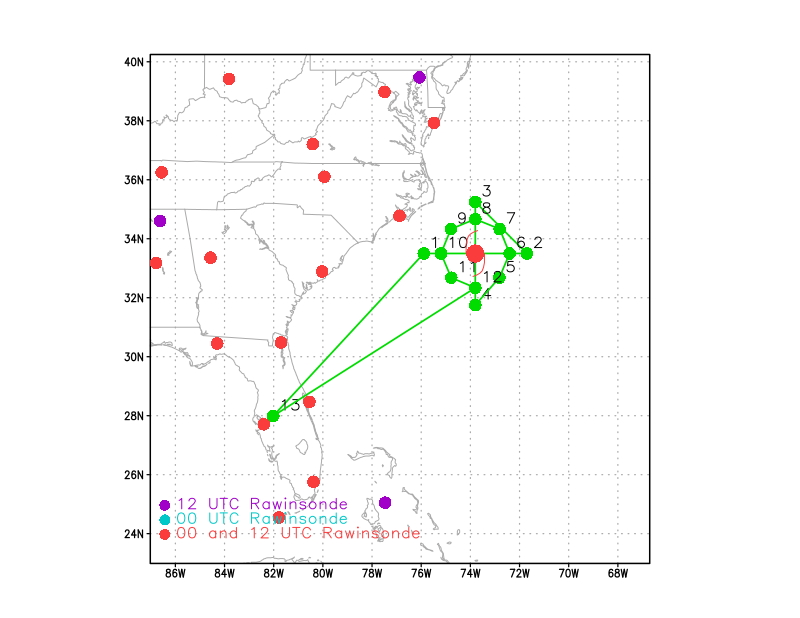
Mission Plan :
42 will conduct an EMC-tasked TDR mission for Sunday 1630L (2030Z) takeoff,
targeting the 00Z HWRF forecast cycle. The track (Fig.1) is an initial rotated
Figure-4 pattern at 8,000 ft radar altitude, with the IP on the west side, 105
nmi legs, final point on the south side. Then climb to >20 kft (as high as
possible), counterclockwise circumnavigation at 70 nmi from the center. A total
of 13 dropsondes is proposed with the endpoint sondes (4), center (1), drop
every 45 deg. azimuth of circumnav. (8). No AXBTs.
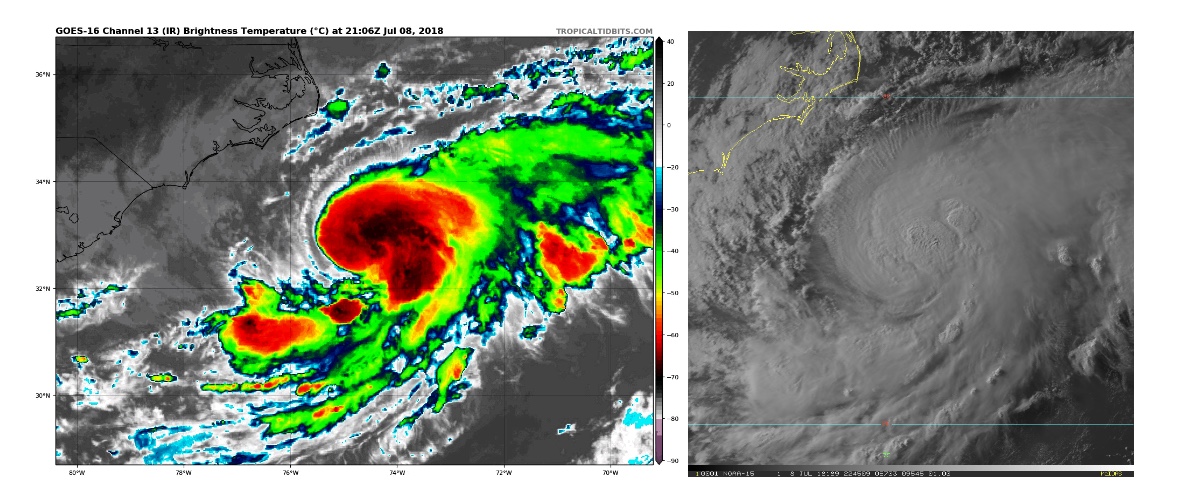
NHC advisory at 2100 UTC for the storm position is at 32.7°N, 74.6°W
with estimated minimum central pressure 1008 mb and the max sustained winds 45
kt with gusts to 55 kt. Satellite presentation of the storm shows the storm is
getting better organized, the strongest convection mostly located in the
east-northeast of the storm (Fig. 2).
Chris remains in between two mid-level highs and a mid- to upper-level trough
to its northeast (Fig.3) that caused the cyclone is nearly stationary. The
currents are forecast to remain light, so little motion is anticipated during
the next 2 days. Chris is embedded within an environment of medium to low shear
(Fig. 3) and is expected to be over a pool of warm water for the next 2 days.
A mid-level trough forecast to swing eastward across the eastern United States
will provide enough forcing to kick Chris northeastward with increasing forward
speed over the Atlantic beyond 72 hours.
An earlier Air Force reconnaissance plane reported flight-level winds of 51 kt
on the eastern semicircle. NHC's initial intensity is set at 45 kt in this
advisory. Most of the model guidance on track forecasts remains similar within
48 h, but spreads a bit after 72 h, largely due to the forecast difference in
the forward motion of the cyclone (Fig. 4). The intensity guidance from most of
the models forecasts that the cyclone remains to be a tropical storm within 24
h. After 24 h, NHC and some of the models (e.g. SHIPS, HMON) brought the
cyclone to a hurricane strength. After 48 h, majority of the model guidance
forecasts the cyclone to be a hurricane.
TDR MISSION PLAN: Chris
Prepared by the Hurricane Research Division
July 07, 2018
Aircraft: N42RF
Proposed takeoff: 08/2030Z
|
DROP LOCATION TABLE
|
| #
| LAT
| LON
| RAD/AZM
| Time
|
|
| deg min
| deg min
| n mi/deg
| hr:min
| | 1S | 33 30 | 75 54 | 105/270 | 1:25
| | 2S | 33 30 | 71 42 | 105/090 | 2:21
| | 3S | 35 15 | 73 48 | 105/000 | 3:00
| | 4S | 31 45 | 73 48 | 105/180 | 3:55
| | 5S | 32 41 | 72 49 | 70/135 | 4:11
| | 6S | 33 30 | 72 24 | 70/090 | 4:23
| | 7S | 34 20 | 72 48 | 70/045 | 4:34
| | 8S | 34 40 | 73 48 | 70/000 | 4:46
| | 9S | 34 20 | 74 48 | 70/315 | 4:58
| | 10S | 33 30 | 75 12 | 70/270 | 5:09
| | 11S | 32 41 | 74 47 | 70/225 | 5:21
| | 12S | 32 20 | 73 48 | 70/180 | 5:33
| |
Mission Summary :
| Take off
| Landing
| Linder-Lakeland Airport, FL
| 23:32 UTC
| Linder-Lakeland Airport, FL
| 04:52 UTC
| | Penetrations
| 2
| | Expendables
| 6 Dropsonde (EMC)
| |
Take off (at 2332 UTC) was delayed due to engine #2 deice valve problem and
oil leak. This left us only about 3 h max on station time, with one hour and
half for ferry each way.
When we arrived at IP, the strongest convection shifted to northeast. While
inbound in the first leg of the track, 57 kt inbound flight-level wind was
reported. We then did center hunting during the first leg of the figure-4,
where a circle near the center of the cyclone was flown. Center fix showed
the storm motion was 135 degree at 2 kt. While at the inbound of the second
leg, 105 nm north of the storm center, we noticed a big convective band ~70
nmi north of the center. Some lightning was seen as we penetrated that major
convective band. Radar reported echo tops >16 km. Due to the shortened mission,
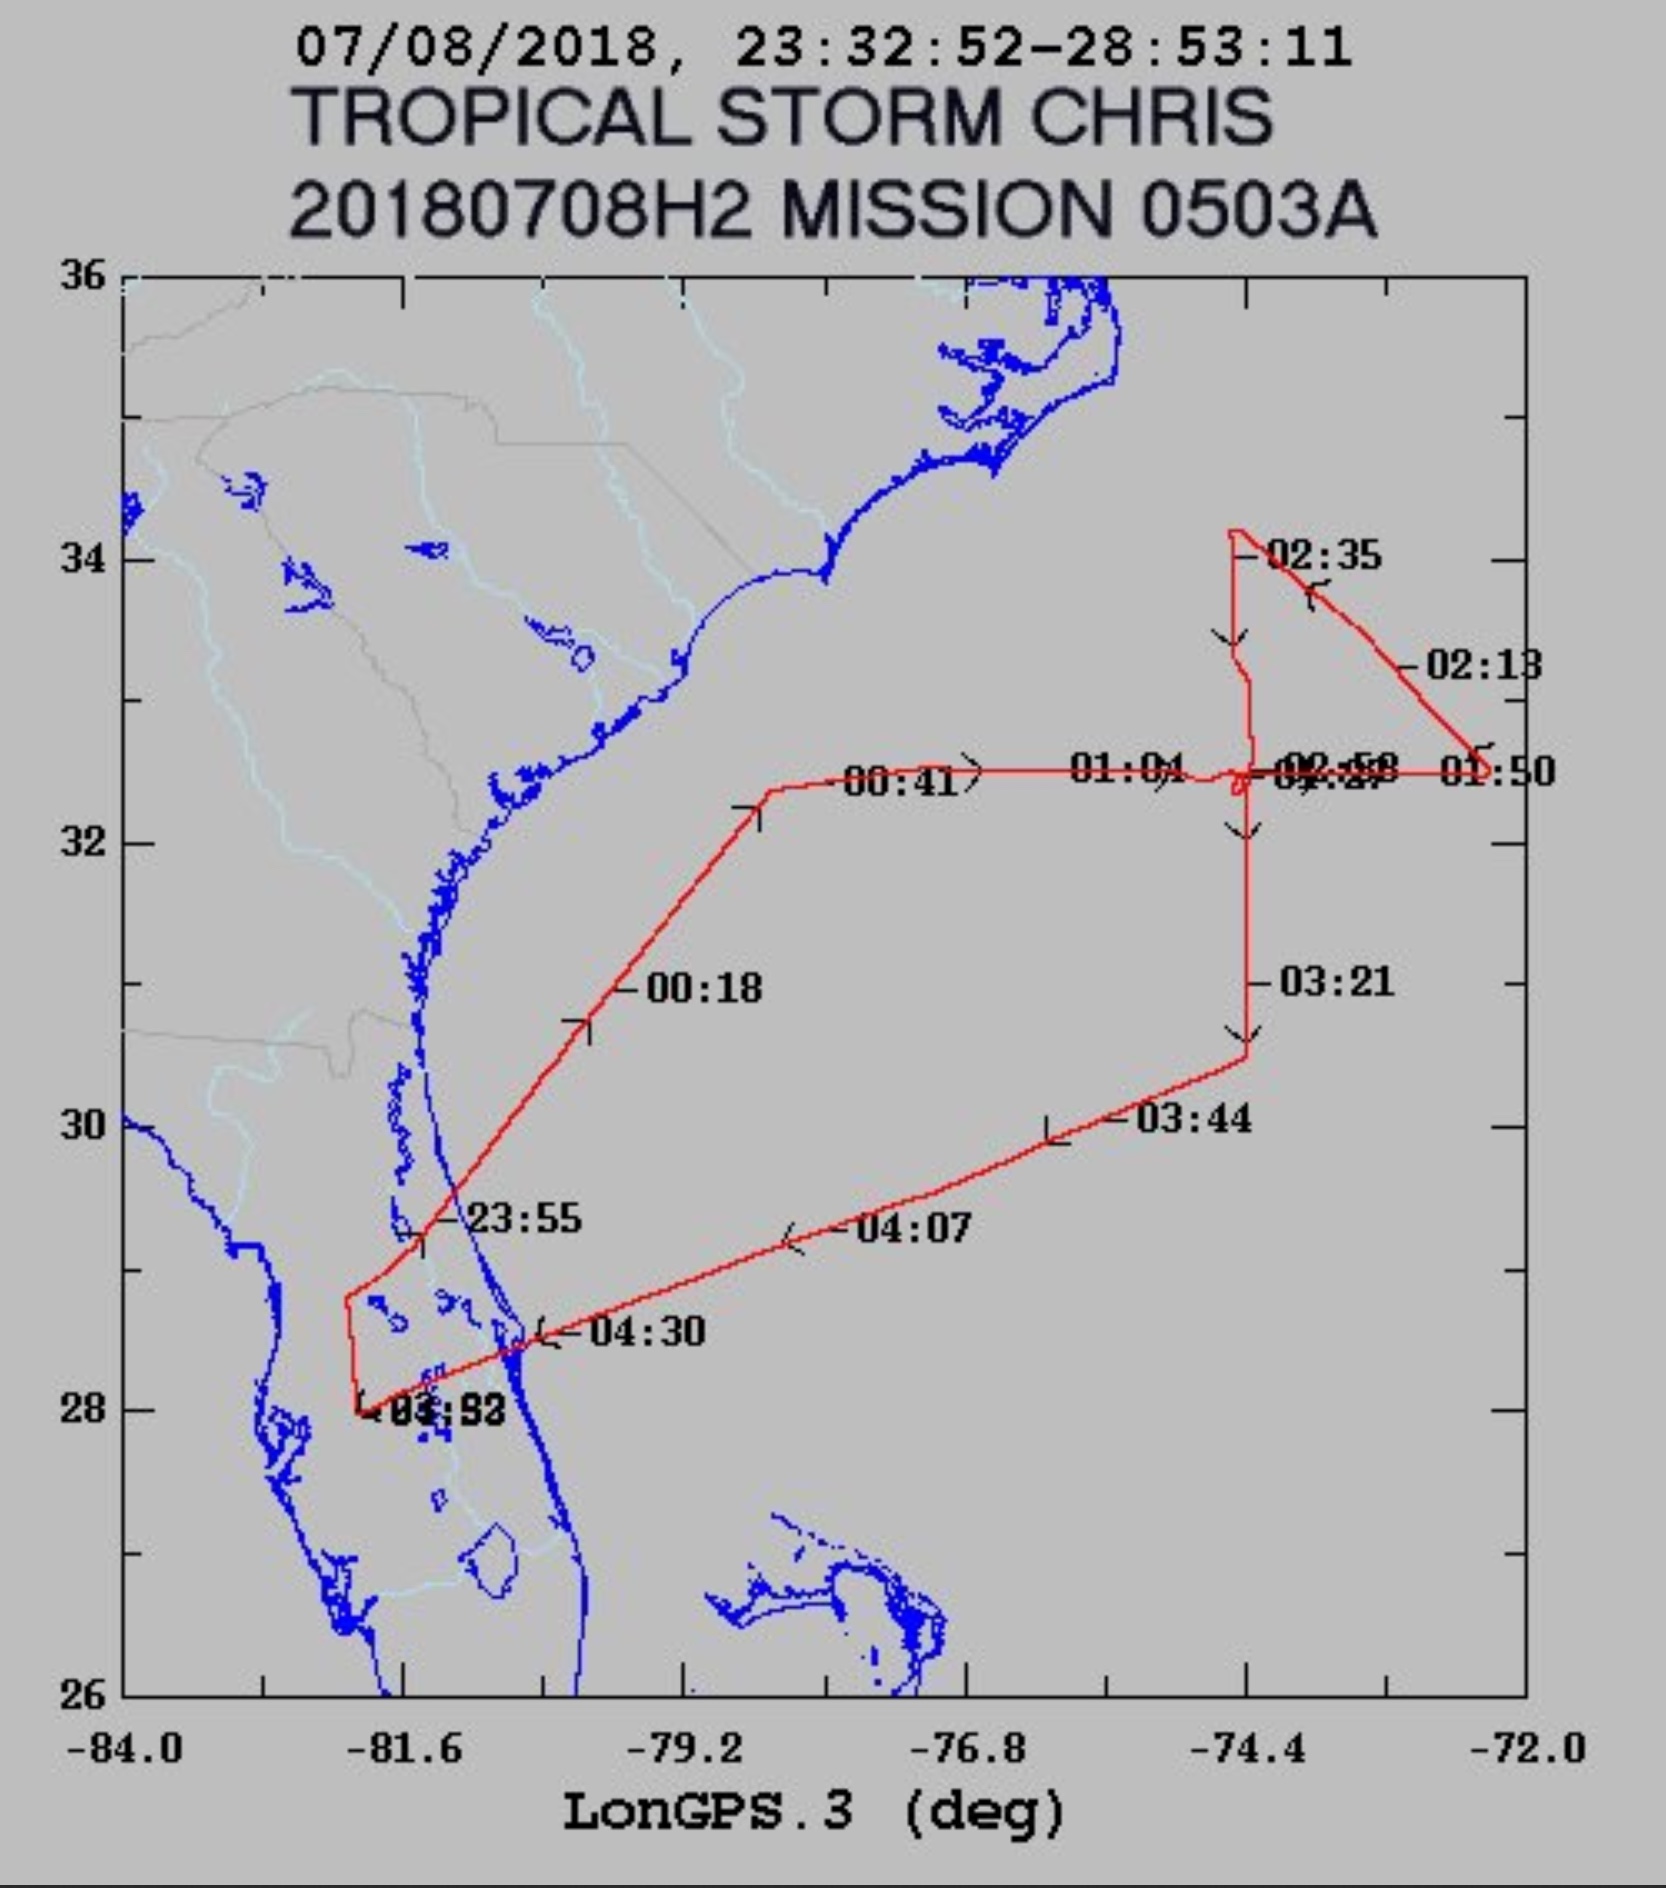
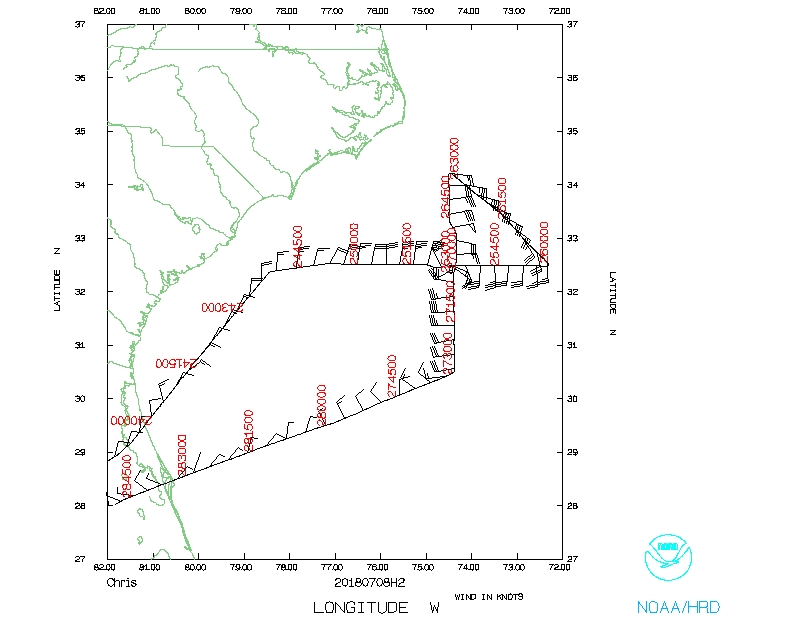
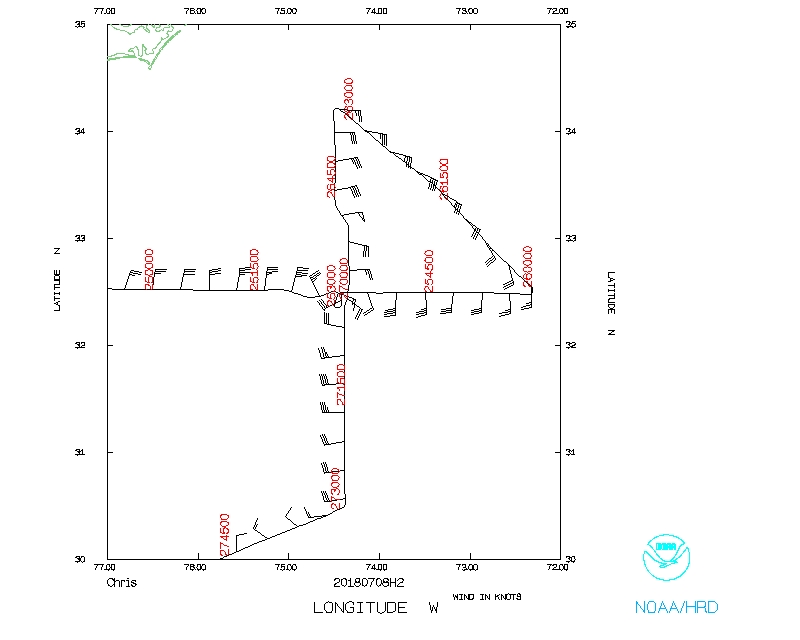
we only completed a single figure-4 pattern (Fig. 5) for the TDR mission. In
total, 6 dropwindsondes (2 center, 4 endpoints) were deployed during the
mission.
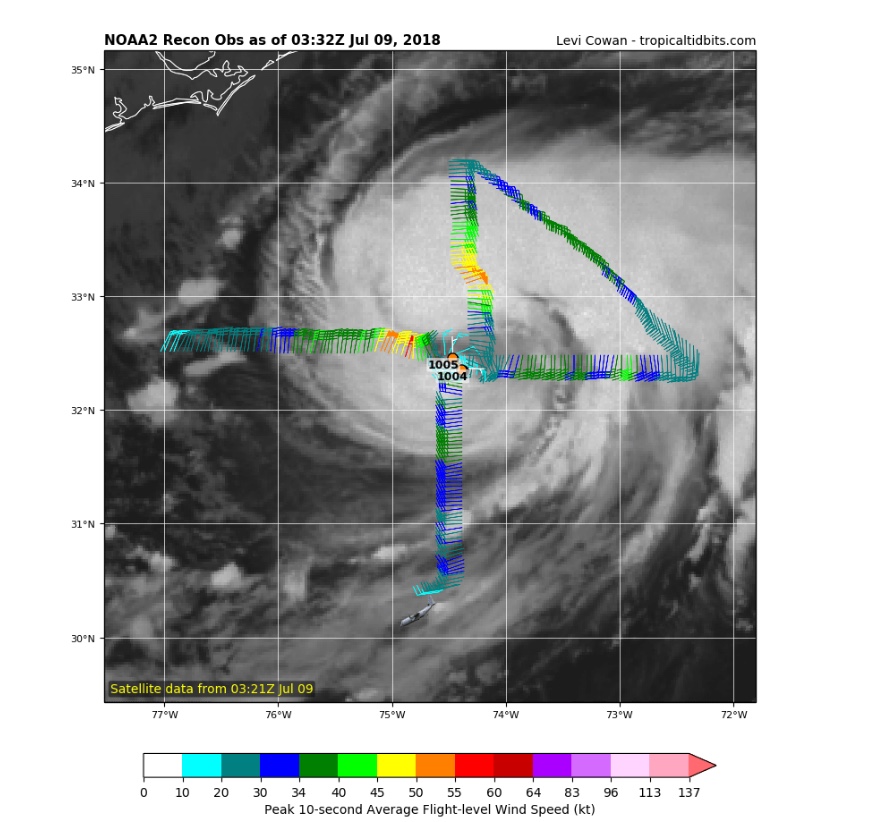
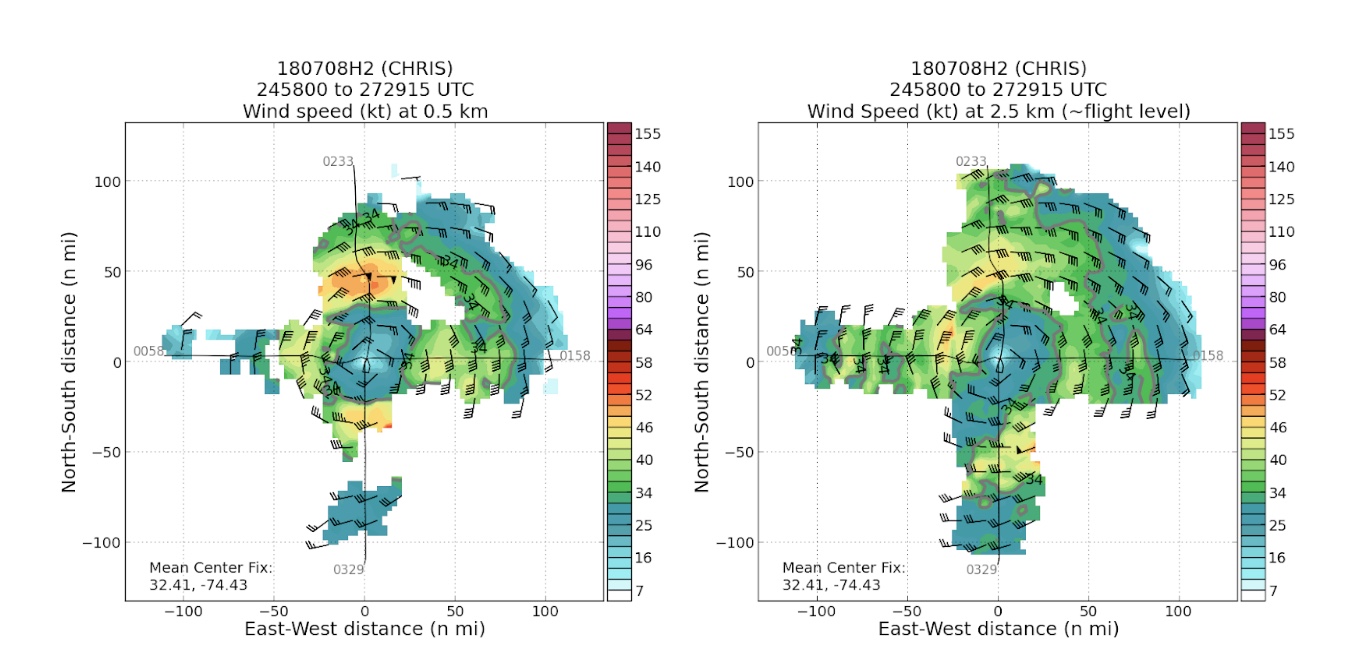
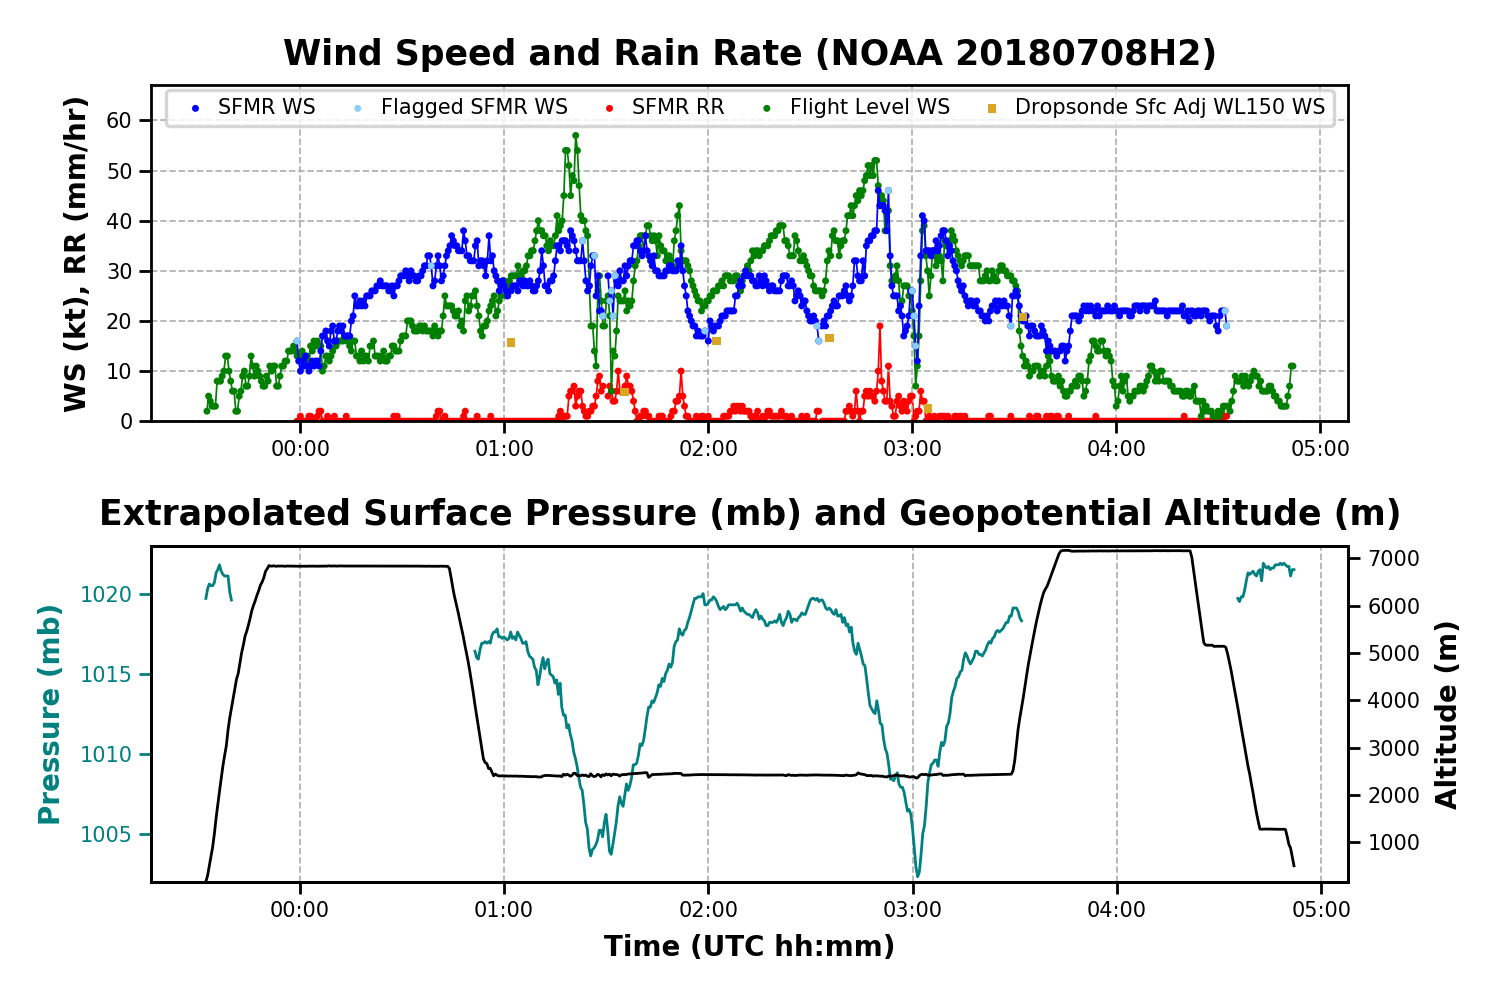
Despite the shortened mission, we were still able to get a decent coverage of
the cyclone sampling. Radar wind analysis showed the strongest wind speed was
located north of the center (Fig. 6), although there could be some
undersampling in the NE quadrant of the cyclone. The strongest reflectivity was
in the NE quadrant of the cyclone (Fig. 7). Radar analysis after the second
center pass also indicated the system became well aligned vertically (Fig. 7).
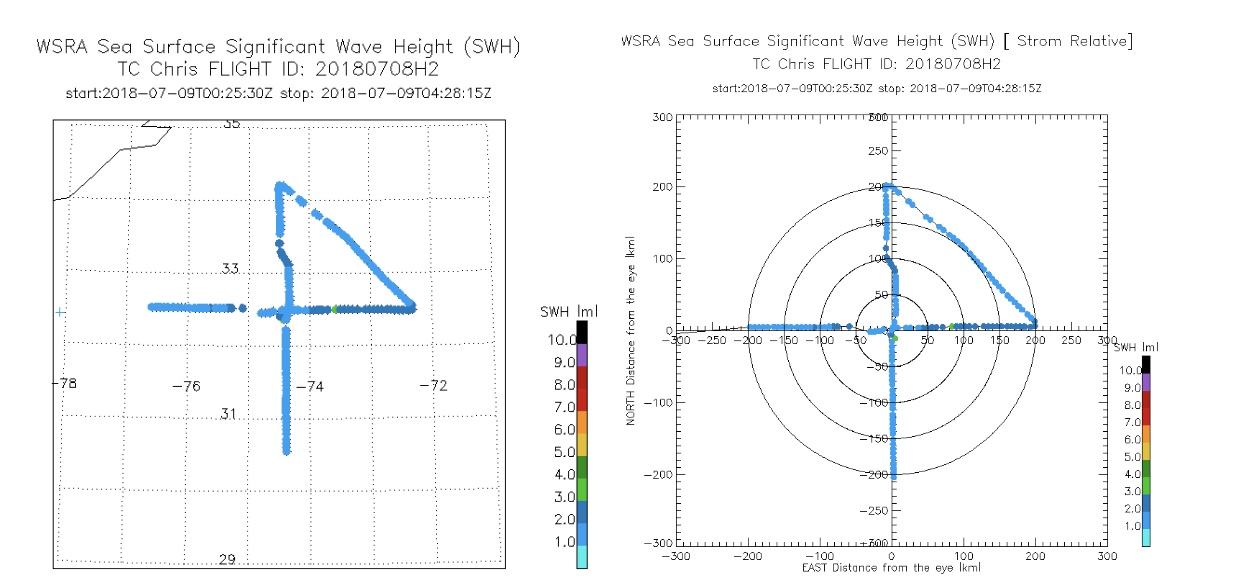
Chris will be on a slowly strengthening trend. We also obtained a good
recording of WSRA sea surface significant wave height data (Fig. 8).
Mission Evaluation/Problems:
AOC crew were extremely supportive. They fixed the plane engine deice issue and
oil leak in a very timely manner that enabled us to collect vital data for
analysis and model assimilation. We were able to collect a single figure-4
pattern that still gave us a decent 3D view of the cyclone.
MMR was operating during the mission but the settings for the radar made
situation awareness very difficult using the MMR. So the flight director used
primarily the nose radar for situation awareness throughout the course of the
mission.
We found radar processing parameters in the plane were not set correctly. Paul
Reasor was able to assist the radar scientists to reset the parameters. During
the second TDR analysis, the terminal in the Linux computer was also not
responsive. We had to close the rsync terminal to re-transmit the data. We
ended up needing to do that for all subsequent analyses during the Chris
missions. Paul Reasor worked with John Gamache and John Hill at AOC to try to
resolve the issue. John Hill made some changes on the AOC data server that
alleviated part of the issue, but Paul and John will need to look at their
real-time scripts to decide how to fix the remaining issues.
Hui Christophersen
19 July 2018
Mission Data :
Flight Director's log |
Flight Director's manifest
NetCDF data |
serial data |
1 second data
LPS#1 log |
LPS#2 log |
Radar log |
Drop log
Page last updated Aug. 15, 2018
Return to Mission page.