| Aircraft Commander | Justin Kibbey |
| Co-pilot | Chris Kerns |
| Co-pilot | Adam Abitbol |
| Navigator | Tim Gallagher |
| Flight Engineer | Ken Heystek |
| Flight Engineer | Chris Lalonde |
| Flight Director | Ian Sears |
| Flight Director | Mike Holmes |
| System Engineer | Terry Lynch |
| System Engineer | Bill Olney |
| Data Technician | Joe Bosko |
| AVAPS | Todd Richards |
| LPS | Rob Rogers (HRD) |
| Radar Scientist | Paul Reasor (HRD) |
| AXBT Scientist | Eric Uhlhorn (HRD) |
Mission Plan :
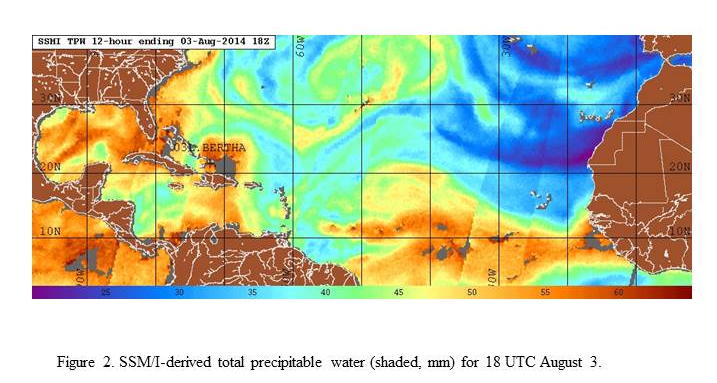
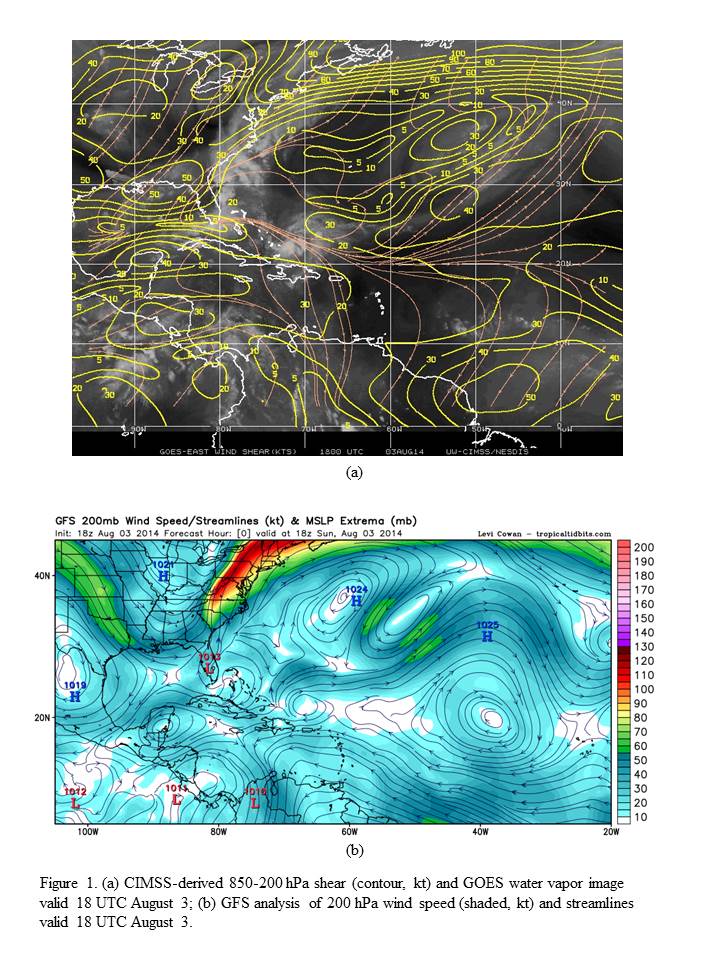
The moisture environment of Bertha (Fig. 2) shows an intrusion of air with low total precipitable water along the west side of the storm. The combination of dry air on the west side and the moderate westerly shear has produced a highly asymmetric distribution of precipitation. A visible image just prior to takeoff (Fig. 3a) shows significant clear air on the northwest side of the circulation, with the majority of precipitation, including some areas of convection, confined to the south and east sides.
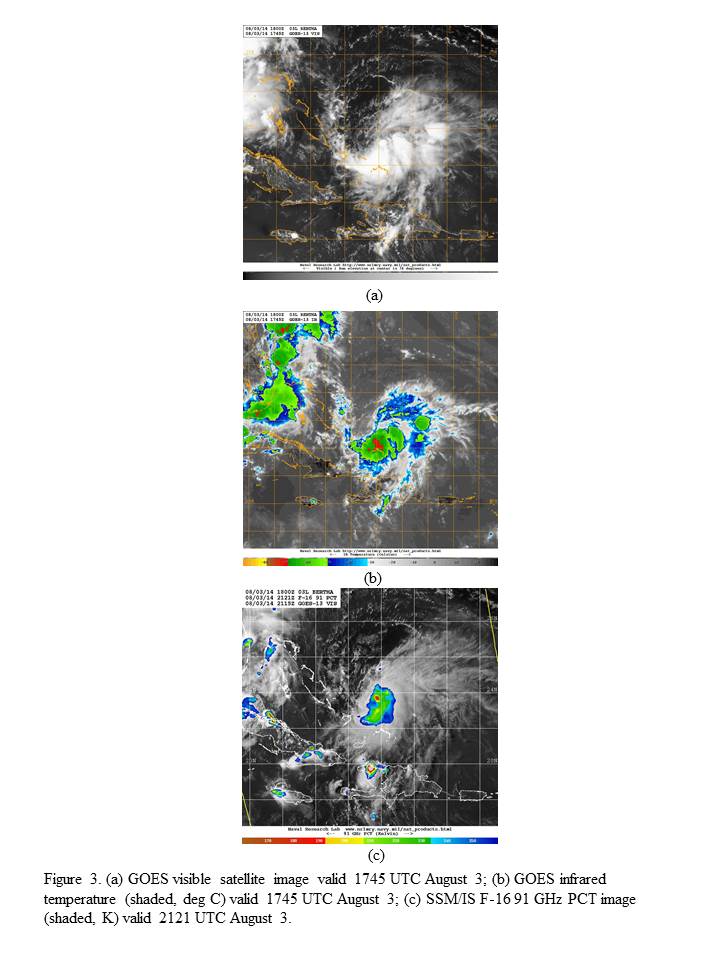
This area of convection is further supported by infrared imagery (Fig. 3b), which shows cloud tops cooler than -70 C in the area of precipitation on the southeast side. A microwave image taken three hours later (Fig. 3c) shows an area of significant ice scattering (91 GHz < 190 K) on the east side of the circulation, indicating deep convection was occurring at least in one section of the inner core.
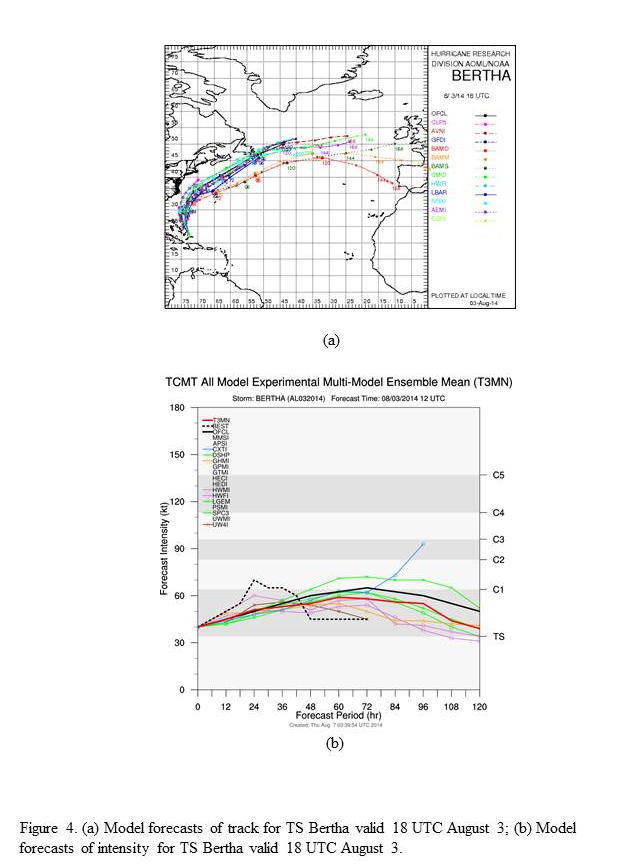
Track model guidance (Fig. 4a) are all tightly clustered around a solution that brings Bertha toward the north-northwest and eventually recurving toward the northeast, off the coast of North Carolina, where there would be little land interaction. The intensity guidance (Fig. 4b) are also tightly clustered, bringing Bertha slowly up to near hurricane strength by 60-72 h. This evolution is seen in both the statistical-dynamical and the dynamical models, and the NHC official forecast reflects this. The actual intensity evolution, based on the working Best Track, shows that Bertha intensified more rapidly than predicted, actually reaching a 70 kt hurricane in 24 h. For this period of time, Bertha underwent rapid intensification (RI), though that period of RI was short-lived.
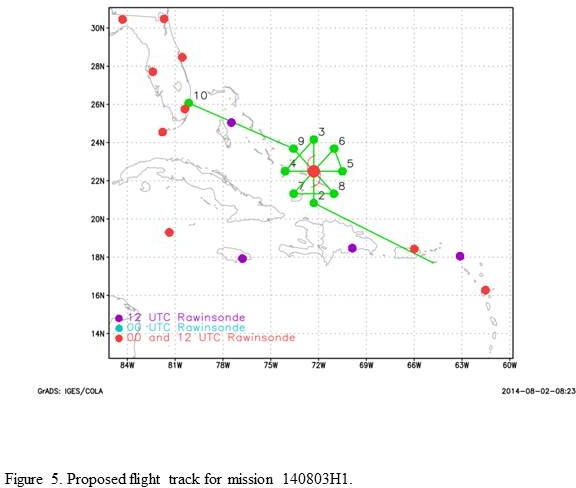
The plan calls for a TDR pattern, as a rotating figure-4 with the initial point on the south side of the circulation (Fig. 5). Leg lengths will be 100 nm. Sondes will be dropped at all midpoints and center fixes. No drops will be released at the turn points, since the G-IV will be flying in close proximity to the P-3 turn points and will provide the dropsonde coverage at these radii. AXBT's will be dropped at all turn points, mid points, and the center. The mission will be flown at 10,000 ft.
Mission Summary :
| Take off | Landing
| St. Croix, USVI | 17:54 UTC
| Ft. Lauderdale, FL | 02:26 UTC
| | ||
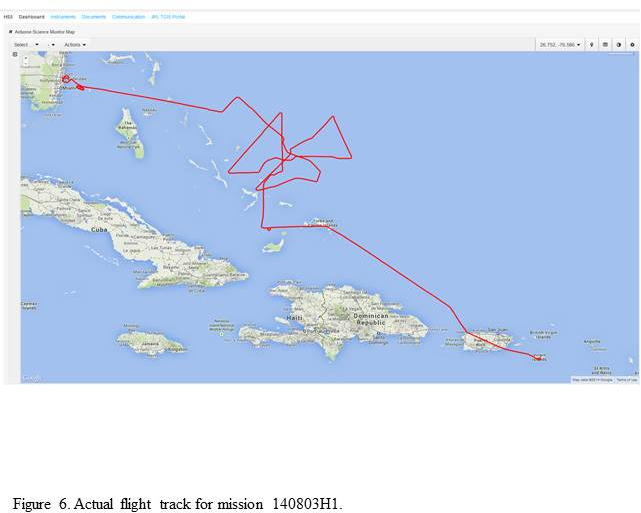
The actual flight track in shown in Fig. 6. Takeoff was at 1754 UTC from St. Croix. There was difficulty locating the center on the first two passes. The storm continued to be asymmetric, with no precipitation on the northwest side and banded precipitation on the east side, including areas of deep convection embedded within.
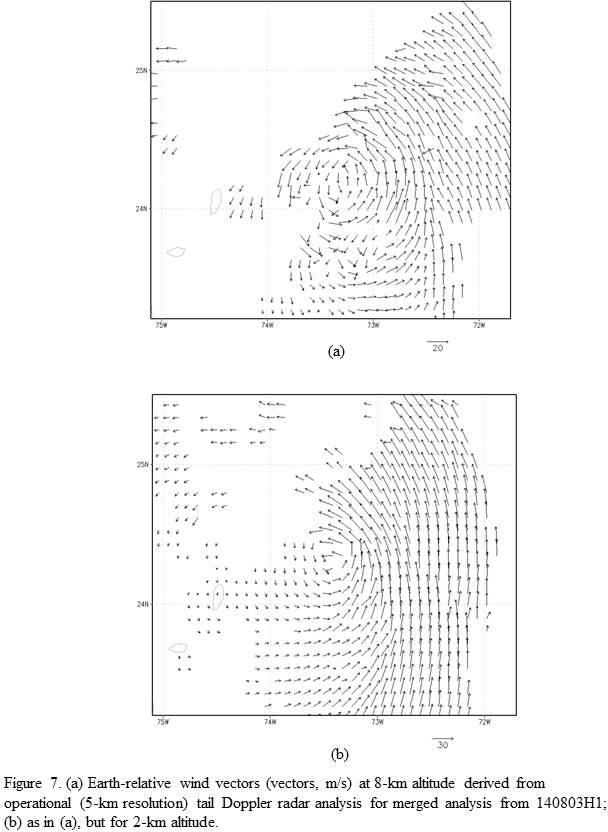
The storm showed an indication of a displacement of the circulation of ~20-30 km between 2 and 8 km altitude toward the southeast (Fig. 7), generally in the downshear or downshear-right direction. There was also an indication of a convective burst in this area of precipitation, with real-time tail radar measurements indicating echo tops up near 16 km altitude. The location of this burst was at and inside the peak winds at 2-km attitude on the east side of the storm (Fig. 8).
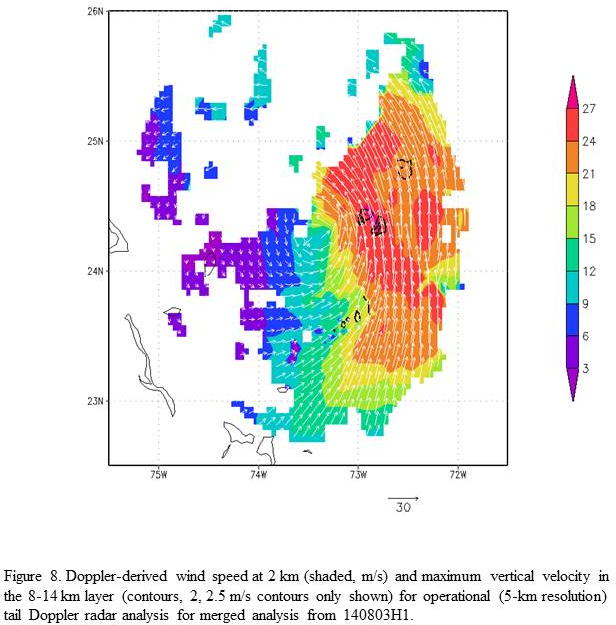
The wind field was also asymmetric, with a peak difference in the wind speeds at and near flight level across the storm of ~20 m/s from the west-southwest to the east-northeast sides. Peak surface winds on the order of 30 m/s were seen on the northeast side, as indicated by both dropsonde and SFMR measurements, and the minimum central pressure was 1004 hPa. This deeper convective indicates that the storm may be getting better organized. The aircraft landed at Ft. Lauderdale at 0227 UTC.
Mission Evaluation:
A total of four radar analyses were created and transmitted in real time, as well as 13 dropsondes and 20 AXBT's. The mission was a success. All radar analyses were completed and successfully transmitted to EMC. Dropsdones and AXBT's also were successful, except for an occasional late or no launch detect. In addition to the TDR data collected and transmitted, this was an interesting case of a tropical storm, while struggling with shear and dry air, nonetheless managing to become a bit better organized as deep convection developed on the downshear side near the storm center. It would be interesting to compare the structure and the evolution of the convection, as revealed by the TDR, during this flight with that of the previous and subsequent days' flights, which had a smaller (or nonexistent) proportion of deep convection, and to document how the convection evolves in a different local environment (e.g., of humidity).
Problems:
There were no major problems with the flight, other than an occasional late/no launch detect of the dropsondes.
Rob Rogers
August 11, 2014
Mission Data :
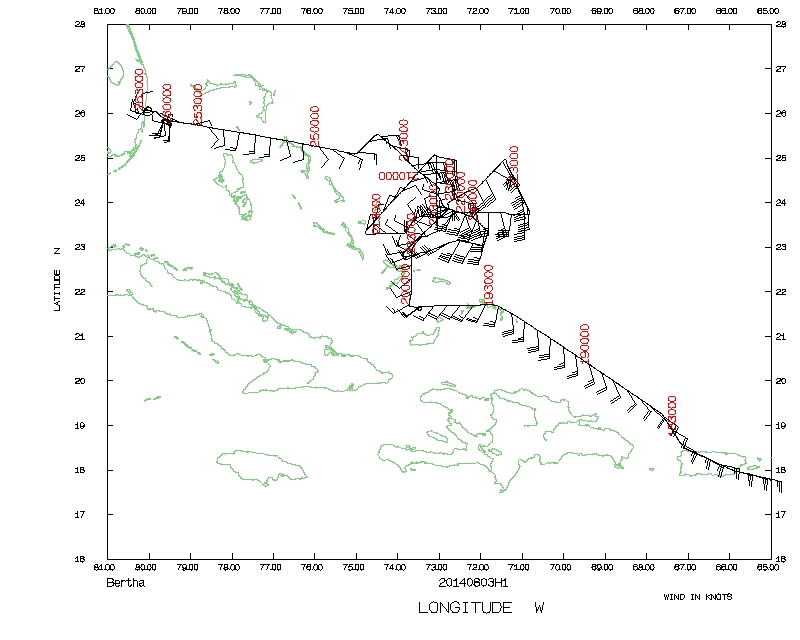 Flight track |
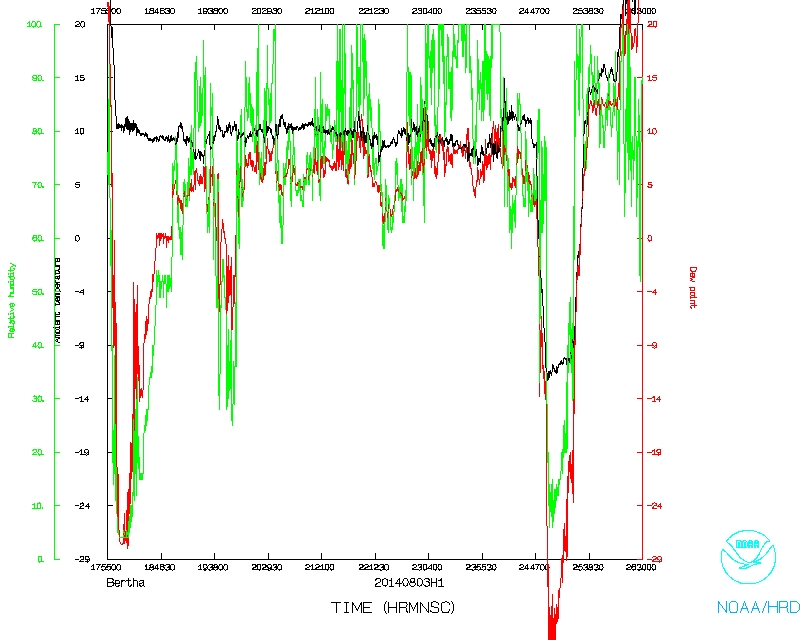 Temperature and Moisture |
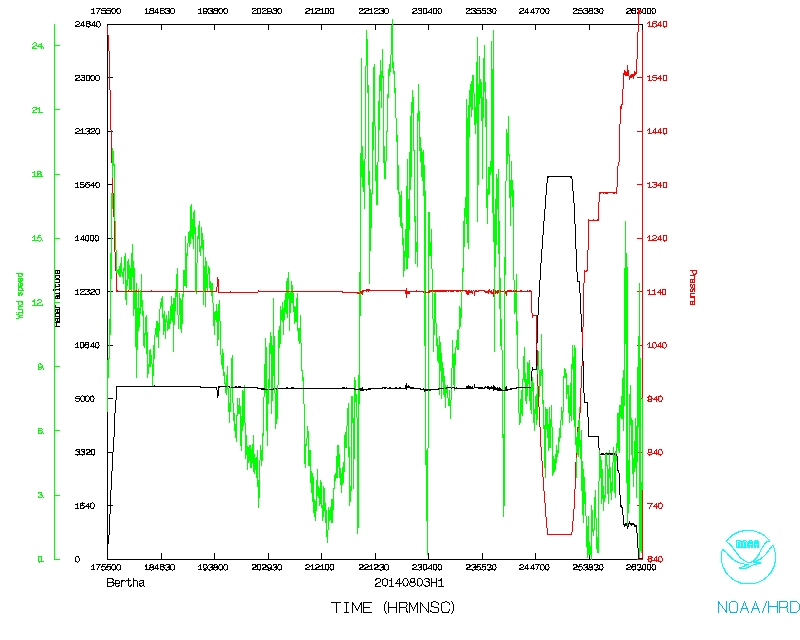 Wind and Atlitude |
|
Flight track detail |