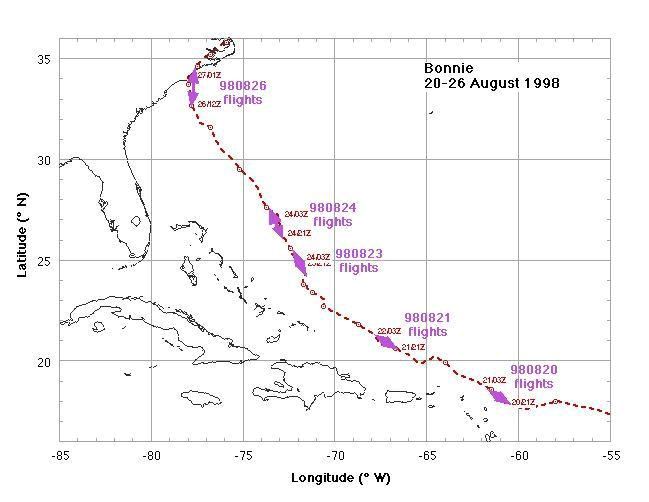
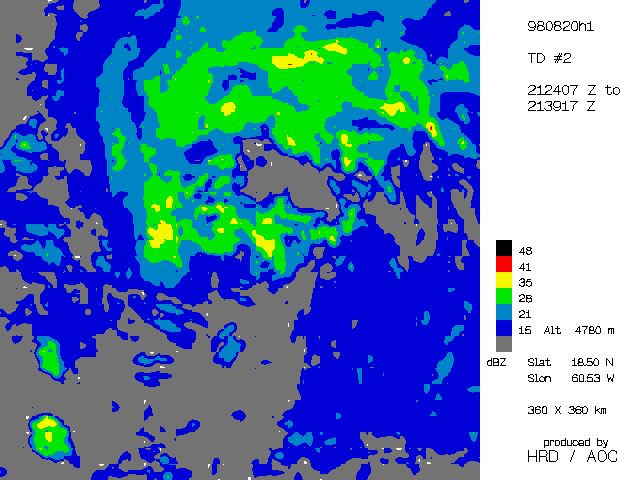
On Wednesday 19 August HRD deployed two NOAA WP-3D aircraft to St. Croix together with the NOAA G-IVSP aircraft to begin an effort to improve the amount of data getting into the numerical guidance models used for tropical cyclone track forecasts at TPC/NHC. TD 2 offered an unique opportunity to try this out. All three NOAA aircraft flew 20 August dropping over 75 dropsondes over the western Atlantic Ocean from New England S to Barbados, with one WP-3D flying into the core of the developing system. >90% of the drops got into the models, providing one of the best initial conditions for a track forecast ever. The aircraft penetrating the core of the disturbance also dropped 7 GPS dropsondes, paired with coincident AXBTs, into the convection within 40 nm of the circulation center. By the end of the mission Bonnie was a tropical storm.
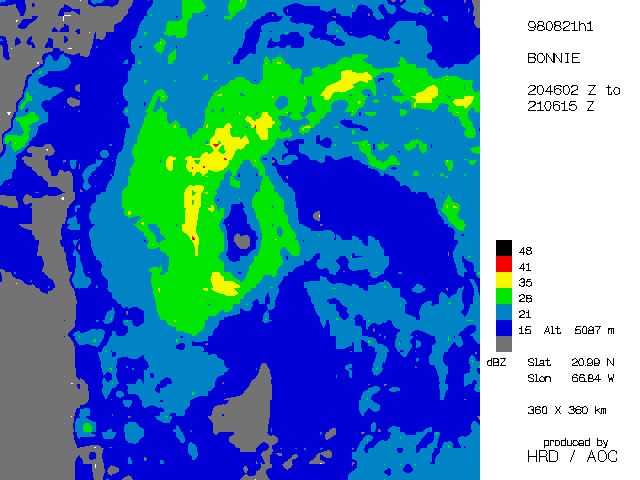
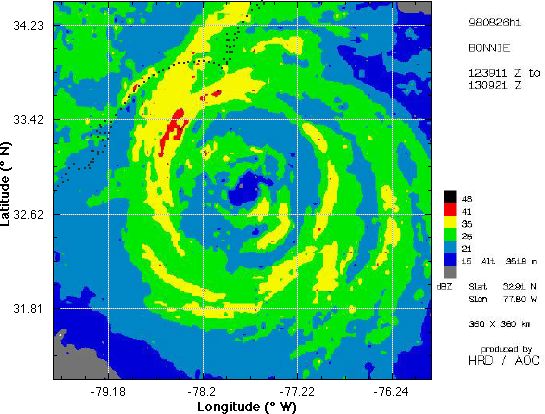
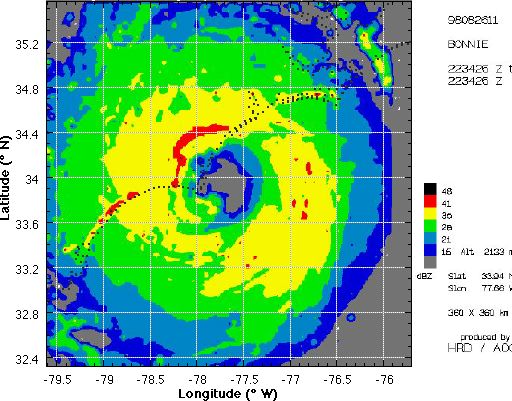
A second 3-plane surveillance mission was conducted on 21 August, with the addition of the NASA DC-8 aircraft, designated to make water vapor profile measurements over the synoptic environment around the storm. The DC-8 overflew one of the NOAA WP-3D and G-IV tracks N of the center. The second WP-3D covered the region S of the center, with a repeat penetration into the core. This mission was altered when the WP-3D in Bermuda suffered an equipment problem causing them to cancel their mission. However, the G-IV, WP-3D in Barbados, and NASA DC-8 dropped over 60 dropsondes over the western Atlantic Ocean from New England S to Barbados as Bonnie reached hurricane strength moving N of the US Virgin Islands and Puerto Rico. The aircraft penetrating the core of the tropical storm also dropped 6 GPS dropsondes, paired with coincident AXBTs, into the convection within 50 nm of the circulation, documenting the beginning of an eyewall with reflectivity tops in the intense cells W of the circulation center reaching 16 km altitude.
GPS dropsonde (HSA) data format
| Storm/ Date | Aircraft (Duration) | Altitude | Experiment/ Pattern | Comments (expendables) |
| Bonnie | ||||
| 20 August | G-IV (9 h) GPS dropsondes N42RF (9.2 h) mission summary 1 minute listing GPS dropsondes N43RF (9.2 h) mission summary 1 minute listing GPS dropsondes WC-130 |
41 kft 16-23 kft 16-23 kft 1500 ft |
3-plane Synoptic Surveillance. N42RF 100 nm radius Fig. 4 in core. AFRES recon. |
|
| 21 August | G-IV (9 h) GPS dropsondes synoptic flow assessment N42RF (9.5 h) mission summary 1 minute listing GPS dropsondes AXBT zipped data WC-130 DC-8 (8 h) mission summary |
41 kft 16-23 kft 1500 ft 37 kft |
3-plane Synoptic Surveillance. N42RF 100 nm radius Fig. 4 in core. DC-8 LASE WV profiles along G-IV pattern. |
|
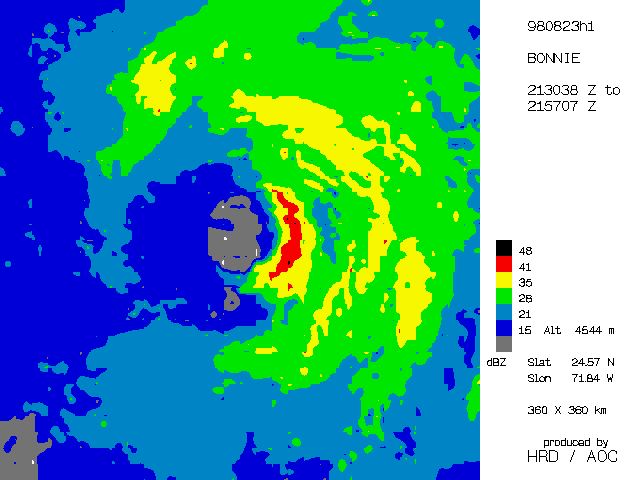
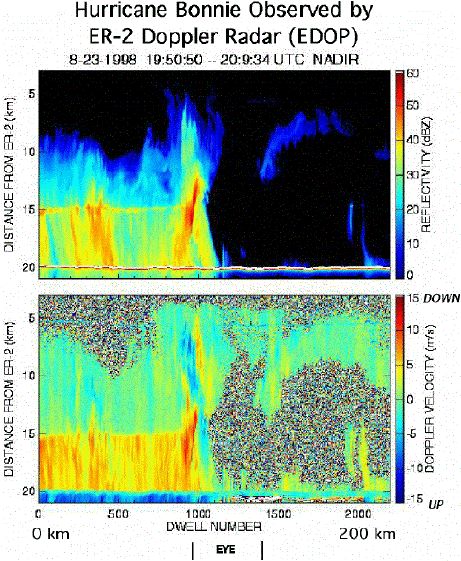
On 23 August 1998 HRD launched a third three-plane Synoptic Surveillance mission into Hurricane Bonnie, with one WP-3D (N43RF) starting from Bermuda covering targets NE of the storm, one WP-3D (N42RF) aircraft starting from St. Croix covering targets SE and W of the storm, and the G-IVSP covering targets NW and N of the storm. Both WP-3D also did Fig-4 patterns in the eye. At the same time NASA flew their first inner core mission to coincide with N42RF Fig-4 patterns. At one point there were four aircraft (AFRES WC-130 at 5000 ft, N42RF at 15,000 ft, DC-8 at 37-39,000 ft, and ER-2 at 65,000 ft) in the inner core of the storm at the same time. Bonnie had slowed considerably and the steering currents were weak and to the N. AXBTs from N42RF revealed that the slow motion had resulted in considerable upwelling of cold water under the storm. The radar data from both NOAA WP-3D aircraft indicated the convective structure was very asymmetric with all of the rain on the ENE side of the center, with some cell tops getting up near the ER-2 altitude. The SW side of the storm had very little convective activity and the eye was not very distinct, with a diameter of 30 nm. There was a hint of a secondary eyewall at 50 nm radius from the circulation center. With the high altitude synoptic surveillance coverage from the G-IV NW of the storm and the DC-8 observations this should be an excellent data set to study upper level trough interaction.
| Storm/Date | Aircraft (Duration) | Altitude | Experiment/ Pattern | Comments (expendables) |
| Bonnie | ||||
| 23 August | G-IV (9 h) N42RF (9.5 h) mission summary N43RF (9 h) mission summary WC-130 DC-8 (8 h) mission summary ER-2 (7 h) |
41 kft 16-23 kft 16-23 kft 1500 ft 35-37 kft 65 kft |
3-plane Synoptic Surveillance with coordinated inner core patterns. N42RF (early) and N43RF (late) 100 nm radius Fig. 4 in core. AFRES recon. DC-8 and ER-2 2 Fig. 4 within 150 nm of center. |
|
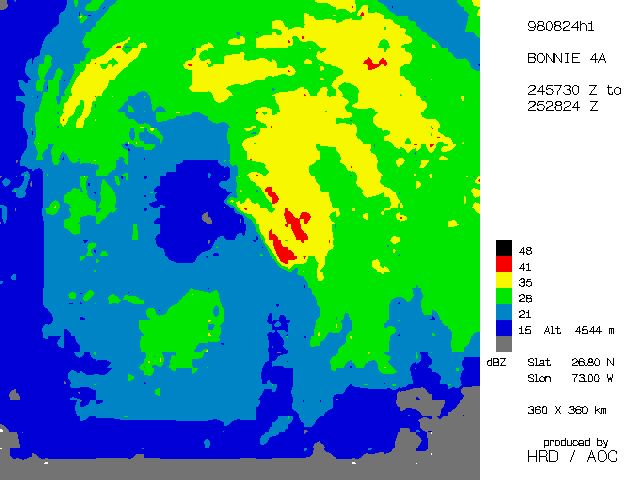
Given the continued slow movement of the storm the modification of the underlying ocean temperatures should be the focus of experiments on 24 August, a modified form of the Air-sea Interaction Experiment with numerous AXBT/GPS sonde pairs dropped in a simple rotating Fig-4 pattern with 100 nm radius legs. N42RF flew at 14,000 ft dropping the expendables, while N43RF followed the same track 10-15 min behind at 5,000 ft using the Scanning Radar Altitmeter (SRA) developed by Ed Walsh (NASA/GSFC) to give two-dimensional wave spectra and the height of the ocean surface. The SRA derived wave field together with the AXBT/GPS sonde pairs should give the best estimate of the surface flux field below a hurricane. The NASA aircraft also flew a series of rotating Fig-4 patterns at 37,000 ft (DC-8) and 65,000 ft (ER-2) with 150 nm radius legs. The DC-8 drops were primarily at the 150 nm radius and in the eye. Coordination was fantastic, with the NASA aircraft arriving at the IP and the eye at the same time as N43RF. During the mission an AFRES WC-130 entered the storm at 10,000 ft on a reconnaissance mission and the G-IVSP was doing a surveillance pattern around the storm, giving a total of 6 aircraft to be coordinated. The radar data from both NOAA WP-3D aircraft indicated the convective structure was still very asymmetric with all of the rain on the ENE side of the center (as the day before). The SW side of the storm had very little convective activity and the eye was not very distinct, with a diameter of 30 nm. There was a definite secondary eyewall at 50 nm radius from the circulation center, which contained the strongest surface winds. As on the day before, the NASA aircraft found a confused circulation aloft over the circulation center and numerous eddies swirling around the deep convective cells on the NE side of the low-level circulation. With the high altitude synoptic surveillance coverage from the G-IV NW of the storm and the DC-8 observations this should be another excellent data set to study upper level trough interaction.
| Storm/ Date | Aircraft (Duration) | Altitude | Experiment | Comments (expendables) |
| Bonnie | ||||
| 24 August | G-IV (9 h) N42RF (9.5 h)
mission summary
N43RF (9.5 h)
mission summary
WC-130 DC-8 (8 h) mission summary ER-2 (7 h) |
41 kft 16 kft 5 kft 10 kft 35-37 kft 65 kft |
2-plane mod. Air sea Interaction. G-IV synoptic surveillance 2 WP-3D do same pattern. N42RF dropping AXBT and GPS sondes, N43RF using SFMR and SRA to sample wave and wind fields. @ fly 3 100 nm radius Fig. 4 in core. AFRES recon. DC-8 :ER-2 3 150 nm radius Fig. 4. |
|
Given the slow motion of the storm and the uncertainty about US landfall two WP-3D missions with staggered take off times were scheduled to insure one was present at landfall. Also on 26 August 3 TRMM overpasses of Bonnie occurred between 1147-1340 UTC, so we set the first WP-3D (N42RF) take off to 1000 UTC to fly a Rainband Structure Experiment in conjunction with the two NASA aircraft during the TRMM overpasses. The second WP-3D (N43RF) take off was at 1500 UTC with a primary mission of Windfields at Landfall working with the WSR-88D radars at Wilmington, NC (KLTX) and Moorehead City, NC (KMHX). A second objective was to use the SRA to measure the wave field and storm surge along the coast. Also both OU/NCAR DOWs and the Texas Tech portable tower (with wind measurements at 3 heights up to 30 ft) were enroute to NC thanks to coordination between Josh Wurman (OU), John Schroeder (Texas Tech) and Mark Powell (HRD).
On 26 August N42RF took off at 1000 UTC arriving at the storm at 1130
UTC coordinating our first run through the storm with the ER-2 as the TRMM
satellite went overhead for the first pass. The storm was undergoing an
eyewall replacement with a decaying inner eyewall with
a radius of 15 nm and an outer eyewall with a radius of 52 nm. When
we arrived the outer eyewall was roughly 30 nm S of Wilmington. The outer
eyewall had the strongest winds with mean boundary layer winds of 80-90
kt from the GPS sondes. The inner eyewall had scattered convective cells,
but only a weak wind maximum of 65-70 kt. During the mission we noted that
the eyewall was evolving rapidly, not quite a classical contraction, but
the NW portion of the outer eyewall seemed to cut in towards the center
as it crossed the coast forming a new eyewall with a 35-40 nm radius. Around 1600 UTC N43RF was approaching the storm and N42RF
and N43RF did a semi-coordinated Fig-4 in the storm around 1630-1730 UTC,
at which time N42RF and the NASA aircraft departed and N43RF made a run
up the coast NE of the storm to map the storm surge. We learned that the
DOWs were in Wilmington, one downtown and the other at the airport 15-20
nm NE of the first, and that the Texas Tech tower was somewhere in the Wilmington
vicinity. During N43RFs mission the eyewall continued
to evolve contracting, with an intense convective blow-up on the SE
side of the eye.They executed numerous legs along radials to the Moorehead
City WSR-88D and the DOWs. By the time N43RF departed the center was just
E of Wilmington and sliding NE along the coast. These missions should provide
an unprecedented look at the evolution of the windfield at landfall.
| Storm/ Date | Aircraft (Duration) | Altitude |
Experiment/ Pattern | Comments (expendables) |
| Bonnie | ||||
| 26 August | N42RF (9.5 h) mission summary N43RF (9 h) mission summary WC-130 DC-8 (8 h) mission summary ER-2 (7 h) |
41 kft 12 kft 8 kft 10 kft 35-37 kft 65 kft |
Rainband Structure and Hurricanes at Landfall. staggered WP-3D TO, N42RF (early, 10Z TO) rainband, N43RF (late, 15Z TO) landfall (SRA) AFRES recon. DC-8 :ER-2 fly 3 150 nm radius Fig. 4. ER-2 underflight of TRMM overpass. |
|